Copyright © 1997 by Annual Reviews. All rights reserved
| Annu. Rev. Astron. Astrophys. 1997. 35:
389-443 Copyright © 1997 by Annual Reviews. All rights reserved |


3.2. Faint Redshift Surveys
Ground-based redshift surveys have not yet convincingly penetrated past the break point in the optical counts to demonstrate the suggestions above. The bulk of the published work has been concerned with tracking the evolution of the galaxy LF up to B = 24, I = 22, and K = 18; these are the effective limits in reasonable integration times on 4-m class telescopes. Although redshifts are available beyond these limits from the first Keck exposures (Koo et al 1996, Illingworth et al 1996), with the exception of the (Cowie et al 1996, 1997) surveys, these do not yet constitute a controlled magnitude-limited sample. A summary of the published (and where known, unpublished) faint field redshift data is given in Table 1. The Kitt Peak survey discussed provisionally by Koo & Kron in their 1992 review is to be published in a series of forthcoming papers commencing with Munn et al (1997).
| Reference | Survey 1 | Magnitude range | Redshifts |
| Lilly et al (1995) | CFRS | 17.5 < I < 22 | 591 |
| Ellis et al (1996a) | Autofib/LDSS | 11.5 < bJ < 24 | 1726 |
| Cowie et al (1996) | Keck LRIS | 14 < K < 20 | 346 |
| I < 23 | 287 | ||
| Cowie et al (1997) | Keck LRIS | B < 24.5 | 166 |
| Lin et al (1997) | CNOC1 | r < 22 | 389 |
| Koo et al (1996), | Keck DEEP | I < 25 |  115 115 |
| Illingworth et al (1996) | |||
| Munn et al (1997) | KPGRS | R < 20+ | 739 |
1 CFRS, Canada France Redshift Survey (CFHT); Autofib, multifiber spectrograph (AAT); LDSS, Low Dispersion Survey Spectrograph (AAT/WHT); CNOC1, Canadian Network for Observational Cosmology (field component of cluster survey, CFHT); KPGRS, Kitt Peak Galaxy Redshift Survey; DEEP, Deep Extragalactic Evolutionary Probe (Keck). |
|||
The survey data suggest a mean redshift z
0.8 at the break point B = 25, although no complete survey this faint yet
exists. The surveys are still incomplete at some level beyond B
23 and I
21, and this can seriously affect the inferred redshift distribution. There
is, for example, a significant difference between the faint B < 24 LDSS-2
redshift distribution
Glazebrook et al 1995a
used by Ellis et al
(1996a) and that presented by
Cowie et al (1996),
arising presumably from a loss of higher redshift galaxies whose [O II]
emission
was redshifted out of the LDSS-2 spectroscopic window. Such incompleteness
will remain a concern until infrared spectrographs are available that can
systematically track [O II] and
H emission to z
2
(Ellis 1996b).
emission to z
2
(Ellis 1996b).
The most significant results from the redshift surveys are the redshift and type-dependent LFs. Furthermore, provided the spectroscopic surveys sample representative regions that are sufficiently faint to probe the apparent excess population, physical models that explain the counts to fainter apparent magnitude limits can also be tested. By combining data that sample a wide range of apparent magnitude, a range in luminosity is available for z < 0.5 [for the B-selected survey of Ellis et al (1996a)] and z < 1 [for I- and K-selected surveys of Lilly et al (1995), Cowie et al (1996)]. The LFs so derived indicate little change in the volume density of luminous galaxies to -z = 1, whereas less luminous galaxies appear to evolve more rapidly. Ellis et al (1996a) presented evidence for a steepening with redshift of the faint end slope of the overall LF consistent with a rising contribution of less luminous galaxies. The effect is particularly strong when parameterized according to [O II] emission line strength Ellis et al 1996a and UV-optical color Cowie et al 1996. The bulk of the excess population to B = 24 compared to the no-evolution predictions (Figure 5a ) may be largely due to this phenomenon Glazebrook et al 1995a.
Such luminosity-dependent evolution was originally proposed by
Broadhurst et al (1988)
to reconcile their redshift survey with photometric data at brighter limits
(B < 21.5). However, strong evolution at these limits, corresponding to
z
0.25, now seems less likely because of growing evidence for a higher
normalization of the local counts. The early B-selected surveys
(Broadhurst et al 1988,
Colless et al 1990,
1993)
used the Durham-AAT Redshift Survey (DARS;
Peterson et al 1986,
Efstathiou et al 1988)
and APM-Stromlo
Loveday et al 1992
data sets as local benchmarks. As
Ellis et al (1996a)
discuss, the low-z LF derived from the fainter surveys indicates a higher
normalization. An upward revision, consistent with the galaxy counts at B
19, would reduce the original dilemma presented by Broadhurst et al and
Colless
et al, whereby excess galaxies are seen in the counts but within the same
redshift range as expected in the no-evolution case. The implication of this
change may be that some local data is unrepresentative, possibly because
of photometric difficulties at bright apparent magnitudes or because the
survey regions used are deficient in galaxies for some reason. The effect
is apparent also in the source counts
Maddox et al 1990.
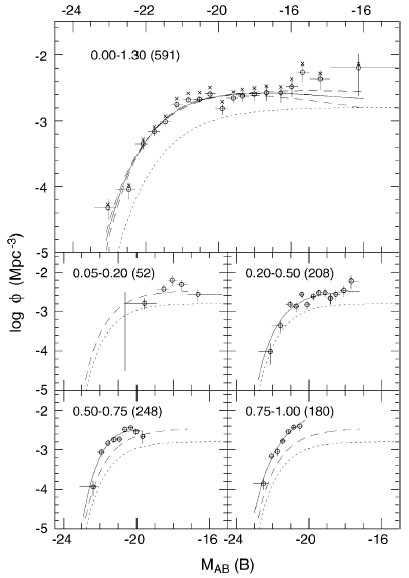
Given the uncertainties in the normalization of the local benchmark samples, Lilly et al (1995) argue that greater reliance should be placed on evolutionary trends determined internally from self-consistent data sets. The CFRS survey has the considerable advantage of probing 0.2 < z < 1 on the basis of a single well-defined photometric scale. The limited apparent magnitude range sampled offers less conclusive results on possible evolution in the shape of the LF (Figure 6a), but the luminosity-dependent trends are similar to those in the other surveys. Whether the shape is changing or the overall LF is brightening can be judged to a limited extent by examining the contrasting behavior of the CFRS and Autofib/LDSS LFs in the redshift ranges where both have reasonable sample sizes (Figure 6b). The CFRS results do admit some luminosity evolution at the bright end, whereas the changes in the Autofib/LDSS LF occur solely for the less luminous objects.
 |
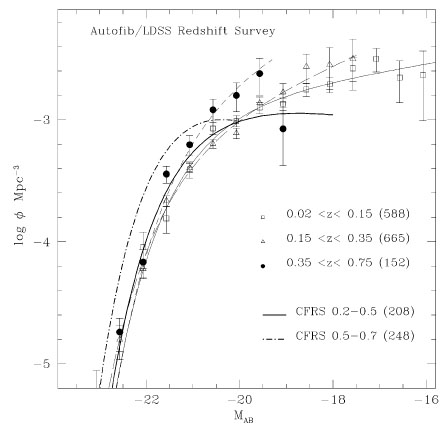 |
Figure 6. (a) The rest-frame B(AB)
luminosity function for various redshift ranges derived from the CFRS
Lilly et al 1995;
numbers in parentheses denote sample size. Solid and dashed
curves represent fitted Schechter functions (best fit and
1- |
The underlying trend supported by all the major redshift surveys is a marked increase in the volume density of star-forming galaxies with redshift. That this evolution occurs primarily in subluminous galaxies is less clear. Lilly et al (1995) support the distinction in the evolutionary behavior of galaxies redder and bluer than the rest-frame color of a typical Sbc spiral. Cowie et al (1996) conclude the evolution proceeds according to a "down-slicing" trend in progressively less massive systems. Ellis et al (1996a) propose a two-component "passively evolving giant plus rapidly evolving dwarf model" as the simplest empirical description of their data.
 fits); the dotted
curve represents
fits); the dotted
curve represents
 = 1, as in