Copyright © 1997 by Annual Reviews. All rights reserved
| Annu. Rev. Astron. Astrophys. 1997. 35:
309-355 Copyright © 1997 by Annual Reviews. All rights reserved |


4.3. Type Ic Spectral Evolution
The first relatively complete set of spectra illustrating the evolution
of a SN Ic (Figure 10) was obtained by
Filippenko et al
(1990).
Shortly after it was discovered, SN 1987M showed spectral characteristics
typical of SNe Ic. No lines of hydrogen were visible, and the
6150-Å absorption
trough was much weaker than in normal SNe Ia. The strongest features were
the P Cygni profile of the Ca II near-IR triplet, O I
 7774
absorption, and Ca II H&K absorption. As the object aged, Fe II lines
became prominent (e.g. near 4900 Å and 5500 Å). Strong He I
lines did not appear, unlike the case in SN 1984L
(Figure 9), and this is the
basis for identifying SN 1987M as a SN Ic rather than a SN Ib.
7774
absorption, and Ca II H&K absorption. As the object aged, Fe II lines
became prominent (e.g. near 4900 Å and 5500 Å). Strong He I
lines did not appear, unlike the case in SN 1984L
(Figure 9), and this is the
basis for identifying SN 1987M as a SN Ic rather than a SN Ib.
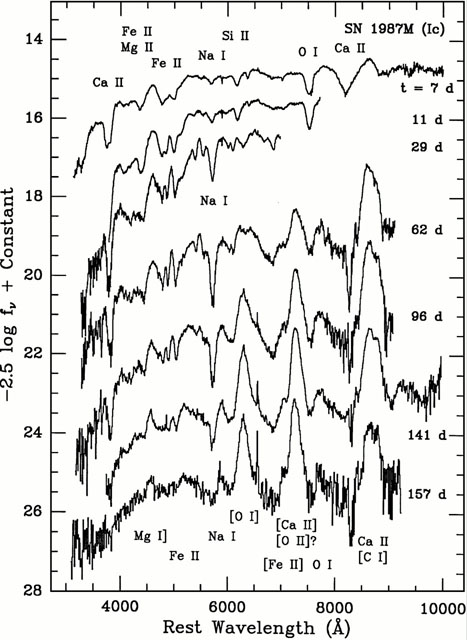 |
Figure 10. Spectra of SN Ic 1987M in NGC 2715 (cz = 1339 km s-1), from Filippenko et al (1990), showing the development of the nebular phase. Epochs (days) are given relative to maximum B brightness (estimated to be September 21, 1987). |
Nebular [O I]
6300, 6364 emission
first emerged at t = 1-2 months, considerably earlier than had
been expected. The two lines initially
had roughly comparable strength, rather than the usual intensity ratio of
three to one, because of self-absorption. The intensity ratio of [O I] and
[Ca II] emission to the Ca II near-IR triplet increased with time as a
consequence
of the steadily decreasing electron density. For a while Na I D absorption
grew deeper, but after 2-3 months it began to fade. By 5 months past maximum
the nebular emission completely dominated the spectrum.
Despite their superficial similarities at early times, the spectra of SNe Ia and SNe Ic evolve in very different manners. The nebular spectra of SNe Ia consist of broad emission-line blends of many forbidden transitions of singly and doubly ionized Fe and Co (Figure 2). SNe Ic (and SNe Ib), on the other hand, are dominated by a few strong, broad, relatively unblended emission lines of neutral oxygen and singly ionized calcium, together with weaker lines of C I, Mg I, Na I, and other intermediate-mass elements (Figure 10).