


3.1. Annotated Images from the Digitized Sky Survey
Figure 1 presents images extracted from the Digitized Sky Survey (DSS1) 10 for all objects in the RBGS. They are intended to quickly visualize the optical morphology in context with the angular and metric size of each object. Horizontal bars on the bottom of each plot show the angular scale labeled in arcminutes, and vertical bars on the lower right side of each plot show the metric scale labeled in kiloparsecs. Metric sizes are derived using the source distance estimates listed in Table 1. The ellipses represent 3-sigma uncertainties in the IRAS positions from the FSC and PSC. Note that for the LMC and SMC, no ellipse is shown because there is no point source from the FSC or PSC corresponding to the "center" of these large, diffuse galaxies. In general there is very good agreement between the IRAS catalog source position and the coordinates of the optical galaxy. A notable exception is the position of IRAS 10574-6603 taken from the PSC, which has a large offset from the optical galaxy ESO 093-G003. The fact that this offset is in the direction of the major axis of the IRAS positional uncertainty ellipse (PA = 150°), and that SCANPI shows a peak in the IRAS emission that is coincident with the position of the optical galaxy, confirms this cross-identification. In some cases the IRAS source position is located between components of optical pairs or groups of galaxies. This is a clear indication that more than one galaxy contributes significantly to the IRAS emission. Such objects (e.g., AM 0702-601, ESO 297-G011 / 12, IC 563 / 4, NGC 7465) are a subset of the pairs and groups investigated using HIRES processing of the IRAS data (Surace, Sanders & Mazzarella 2003), which are flagged by "(H)" following the object names in Figure 1.
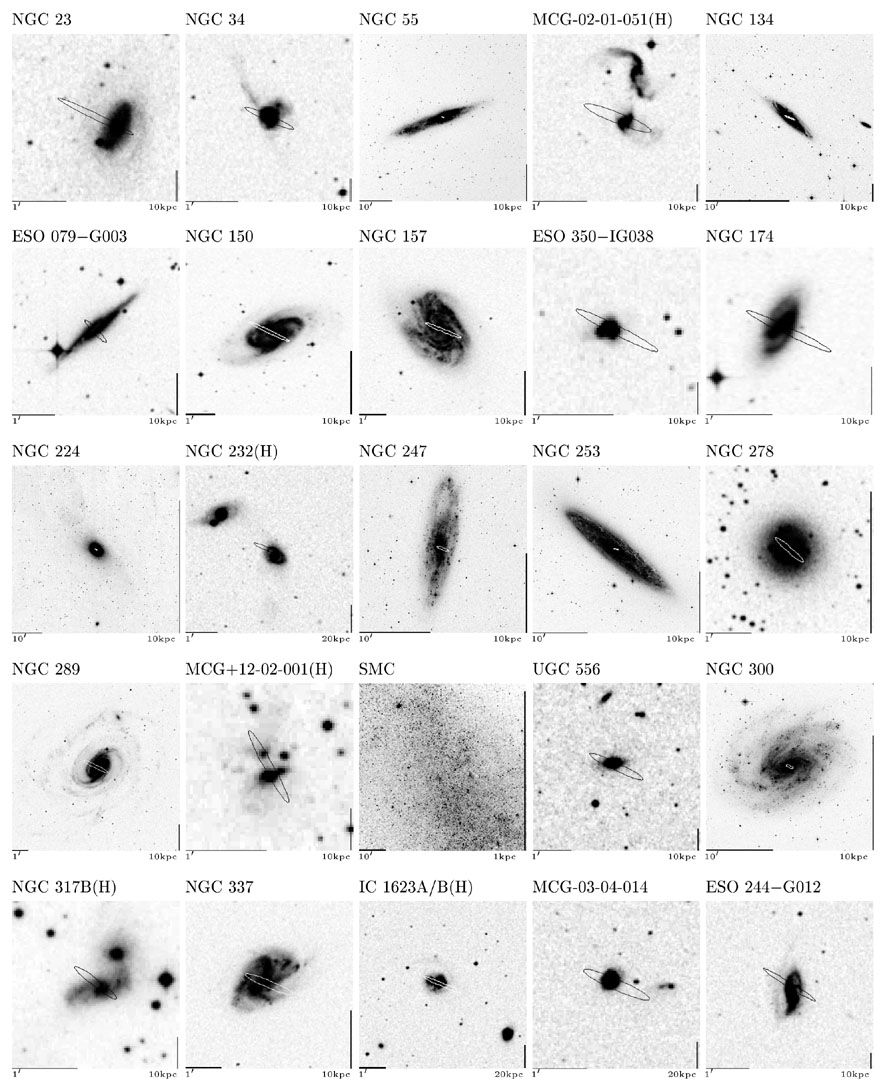 |
Figure 1. DSS1 images of each RBGS
object. Horizontal bars on the bottom
of each plot show the angular scale labeled in arcminutes, and vertical
bars on the lower right side of each plot show the metric scale labeled in
kiloparsecs. The ellipses represent 3-sigma uncertainties in the
IRAS positions. (Note: For the LMC and SMC, no ellipse is shown
because there is no FSC or PSC source corresponding to the "center" of
these large, diffuse galaxies.) Pairs and groups for which improved 2-D
spatial resolution has been attempted using HIRES processing of the
IRAS data
(Surace, Sanders &
Mazzarella 2003)
are indicated by "(H)" following the object name.
|
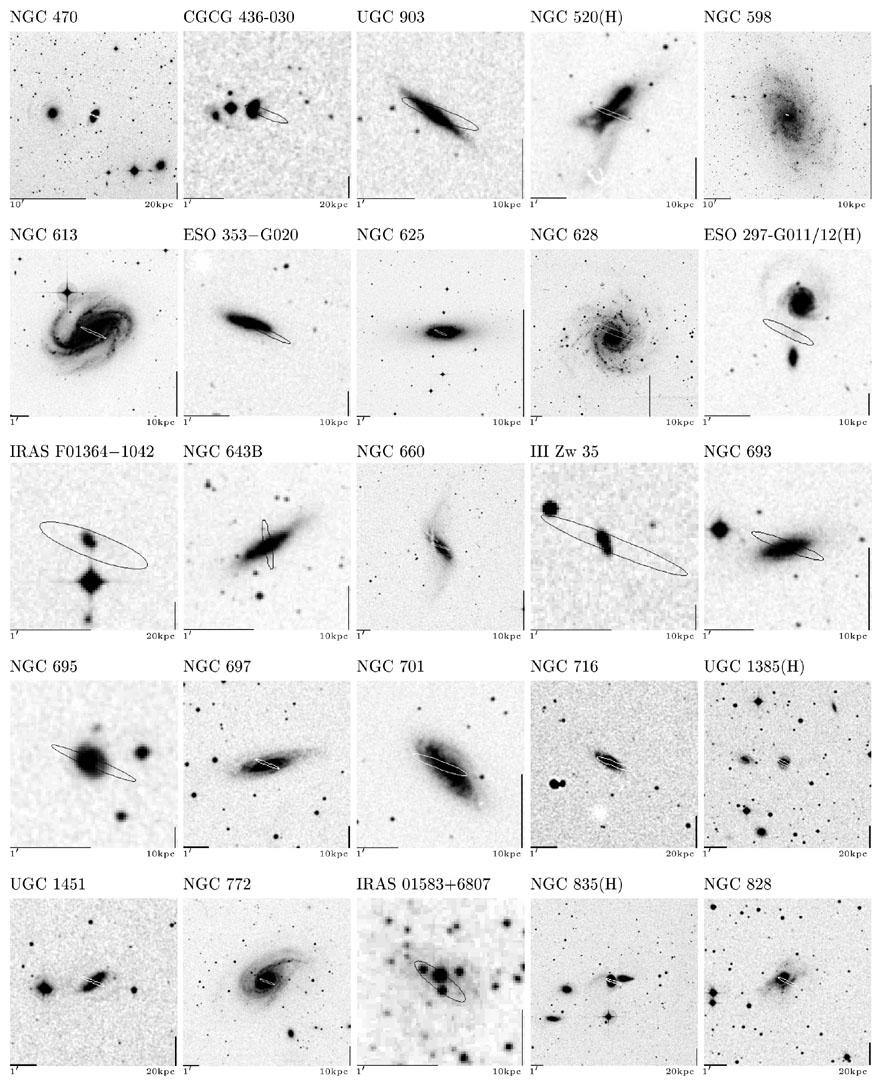 |
Figure 1. Continued (p. 2 of 26)
|
 |
Figure 1. Continued (p. 3 of 26)
|
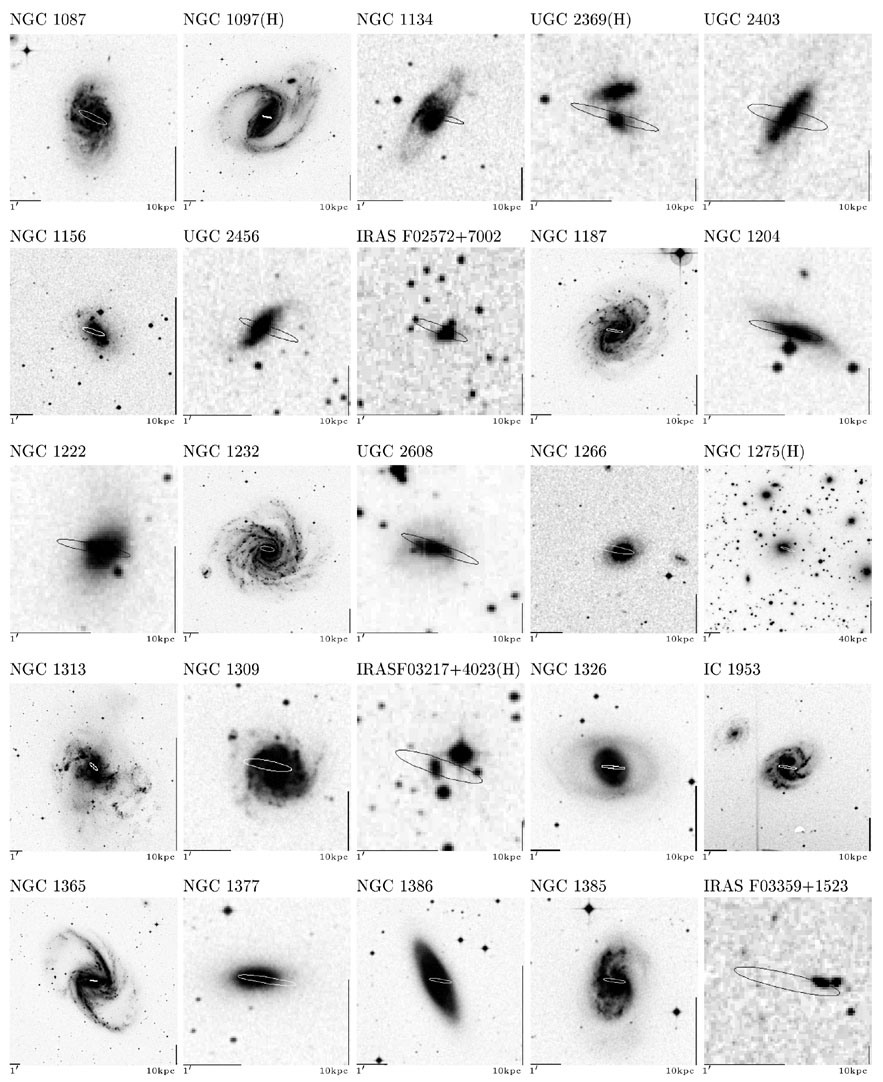 |
Figure 1. Continued (p. 4 of 26)
|
 |
Figure 1. Continued (p. 5 of 26)
|
 |
Figure 1. Continued (p. 6 of 26)
|
 |
Figure 1. Continued (p. 7 of 26)
|
 |
Figure 1. Continued (p. 8 of 26)
|
 |
Figure 1. Continued (p. 9 of 26)
|
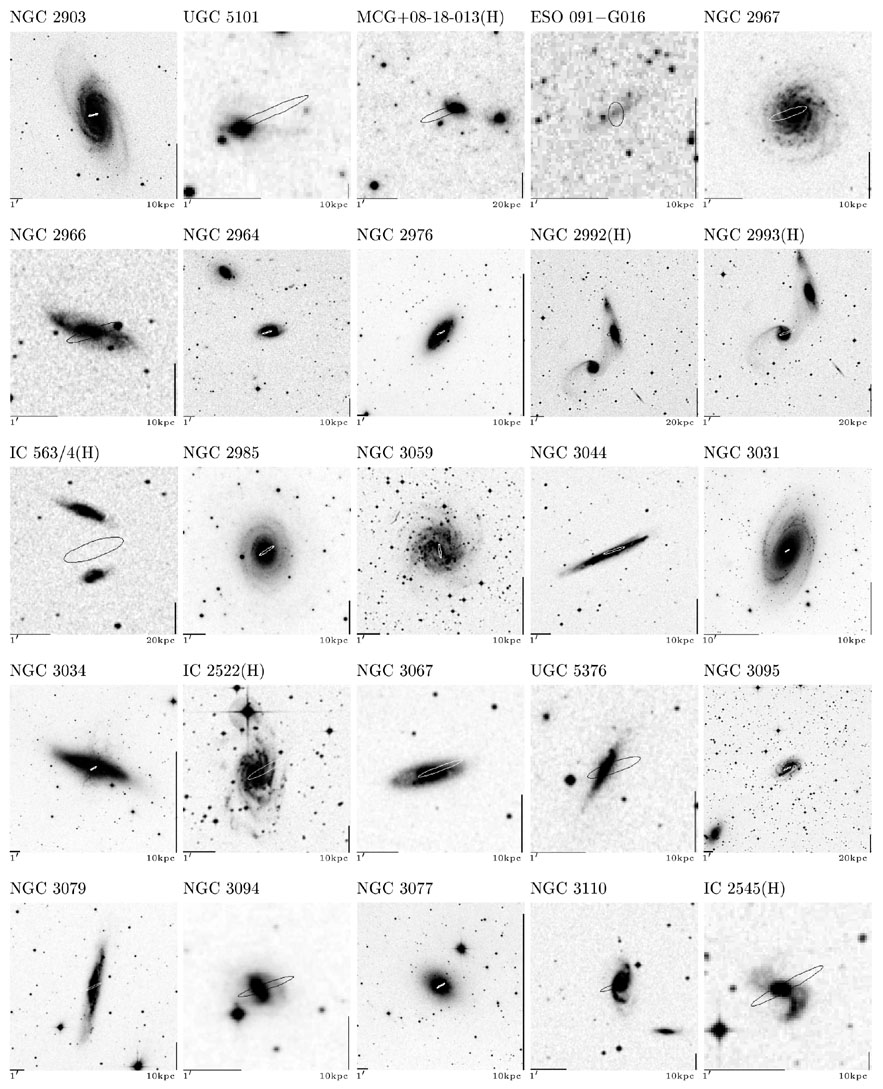 |
Figure 1. Continued (p. 10 of 26)
|
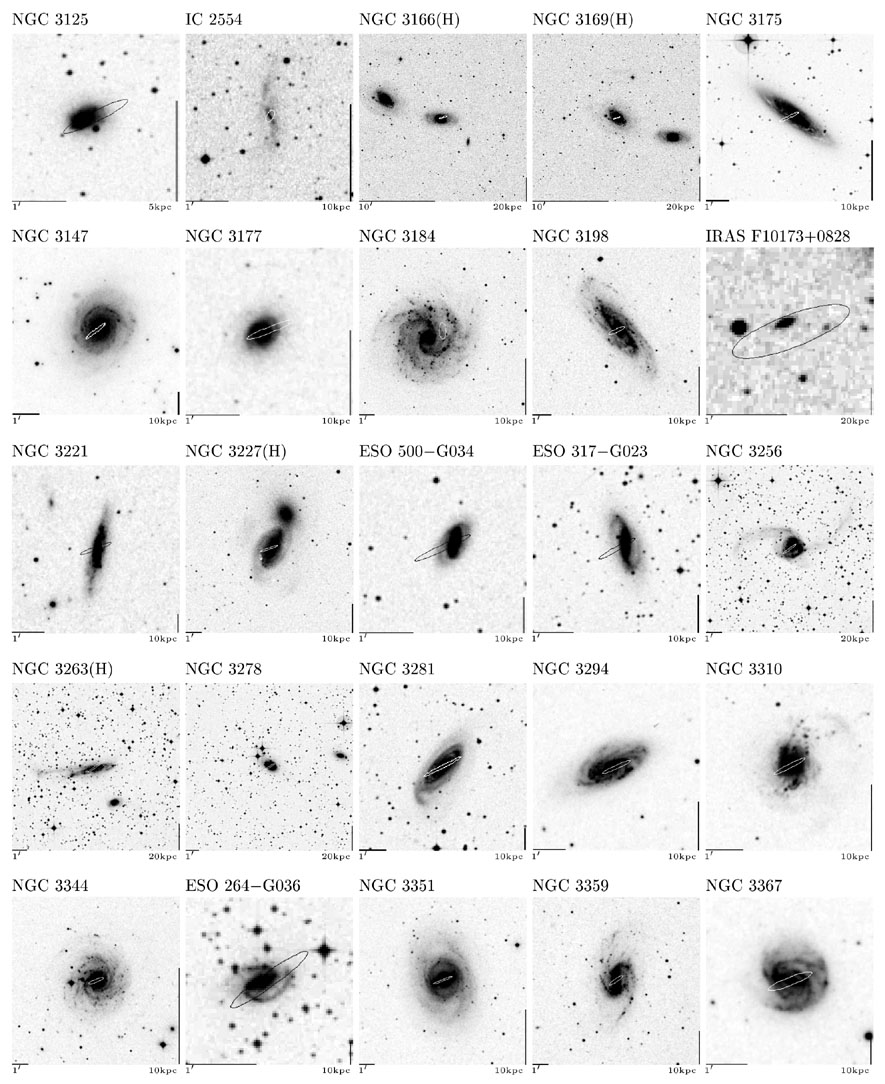 |
Figure 1. Continued (p.11 of 26)
|
 |
Figure 1. Continued (p. 12 of 26)
|
 |
Figure 1. Continued (p. 13 of 26)
|
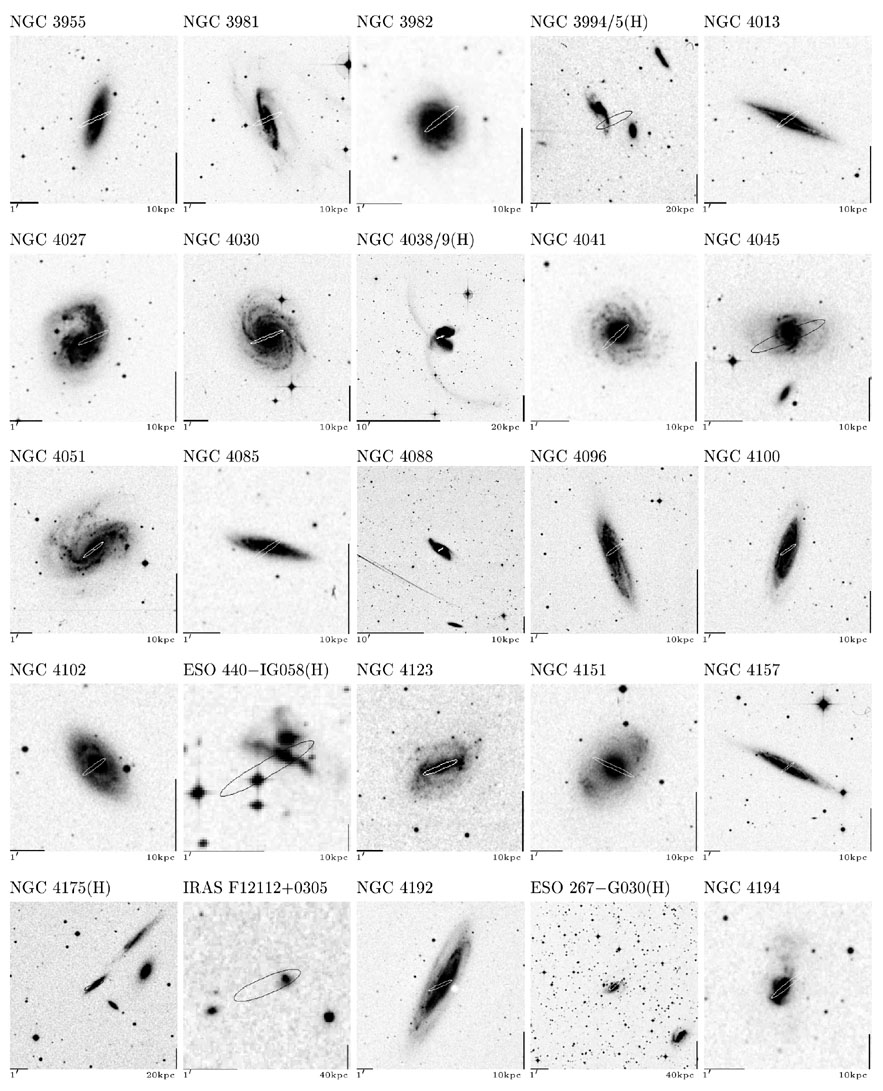 |
Figure 1. Continued (p. 14 of 26)
|
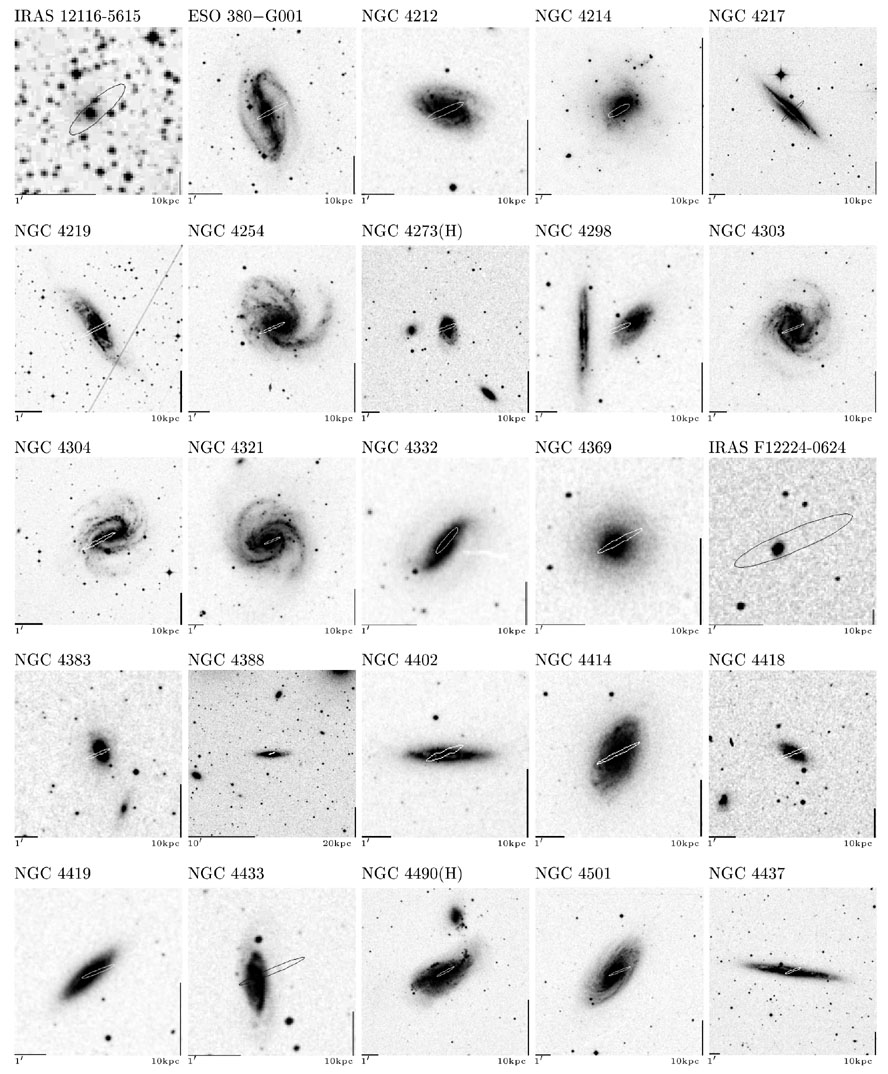 |
Figure 1. Continued (p. 15 of 26)
|
 |
Figure 1. Continued (p. 16 of 26)
|
 |
Figure 1. Continued (p. 17 of 26)
|
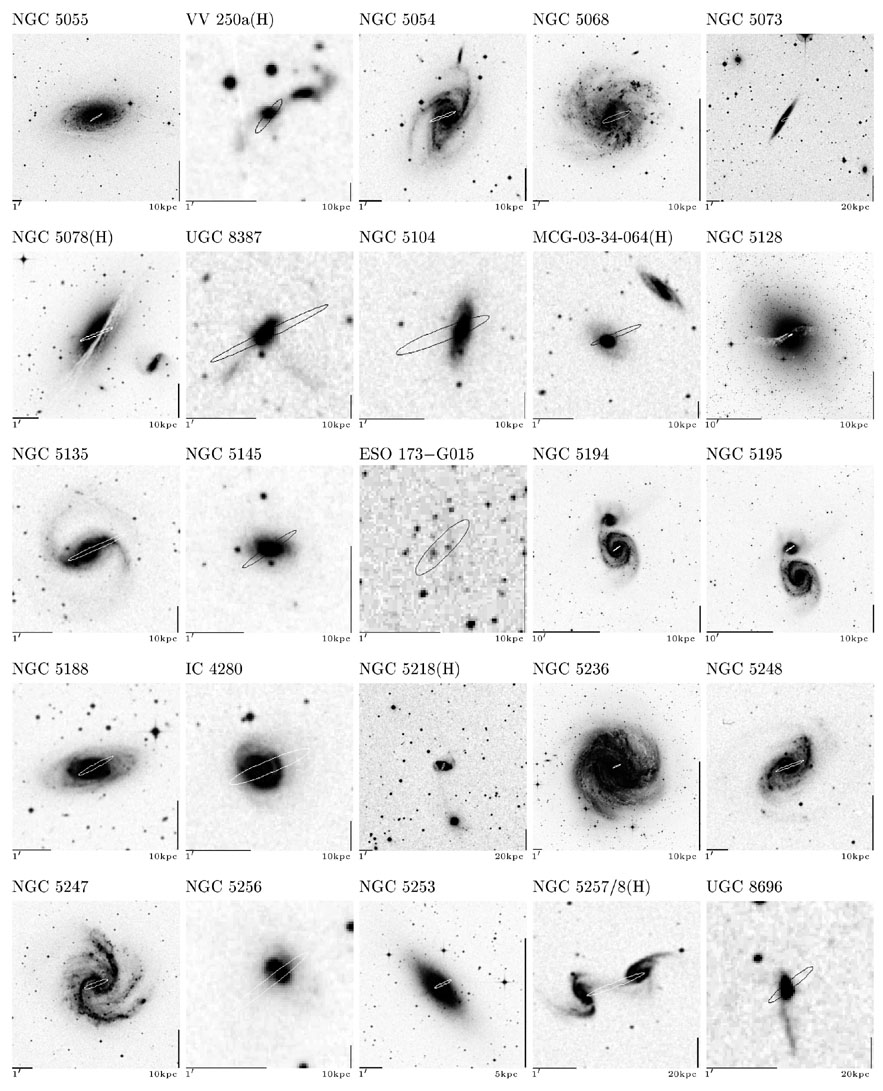 |
Figure 1. Continued (p. 18 of 26)
|
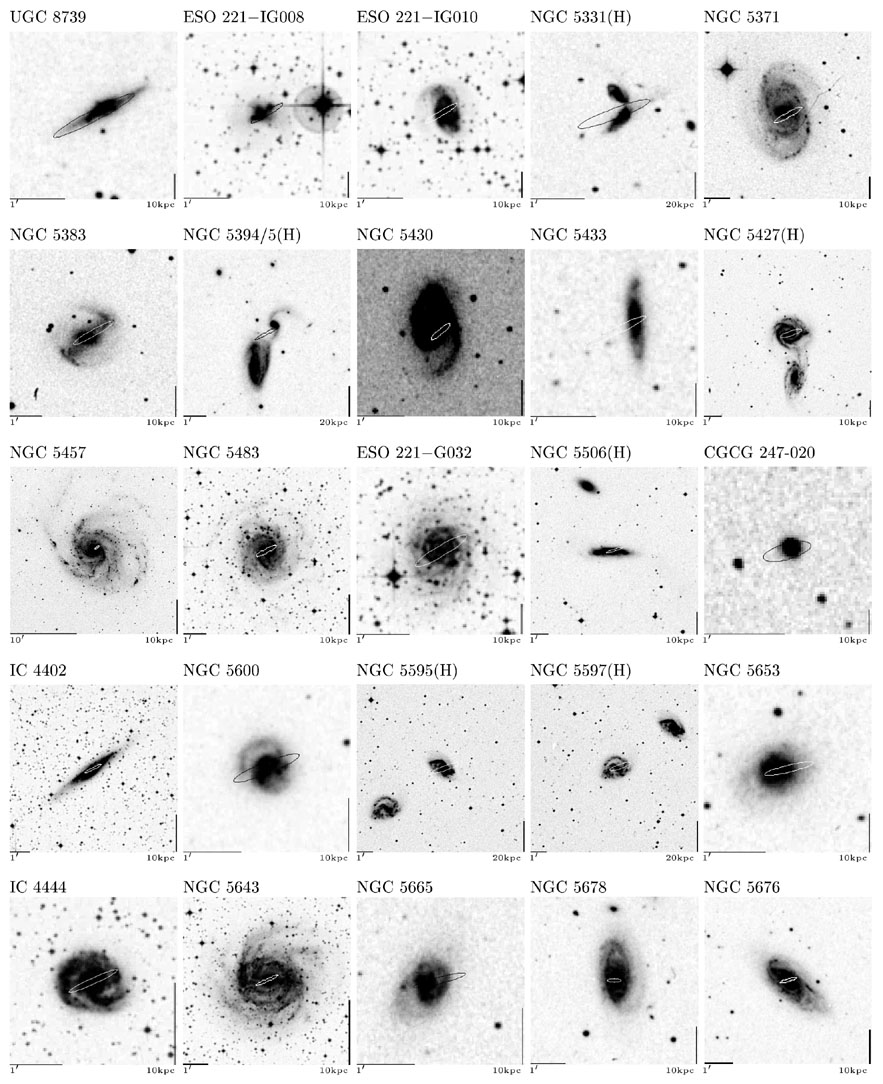 |
Figure 1. Continued (p. 19 of 26)
|
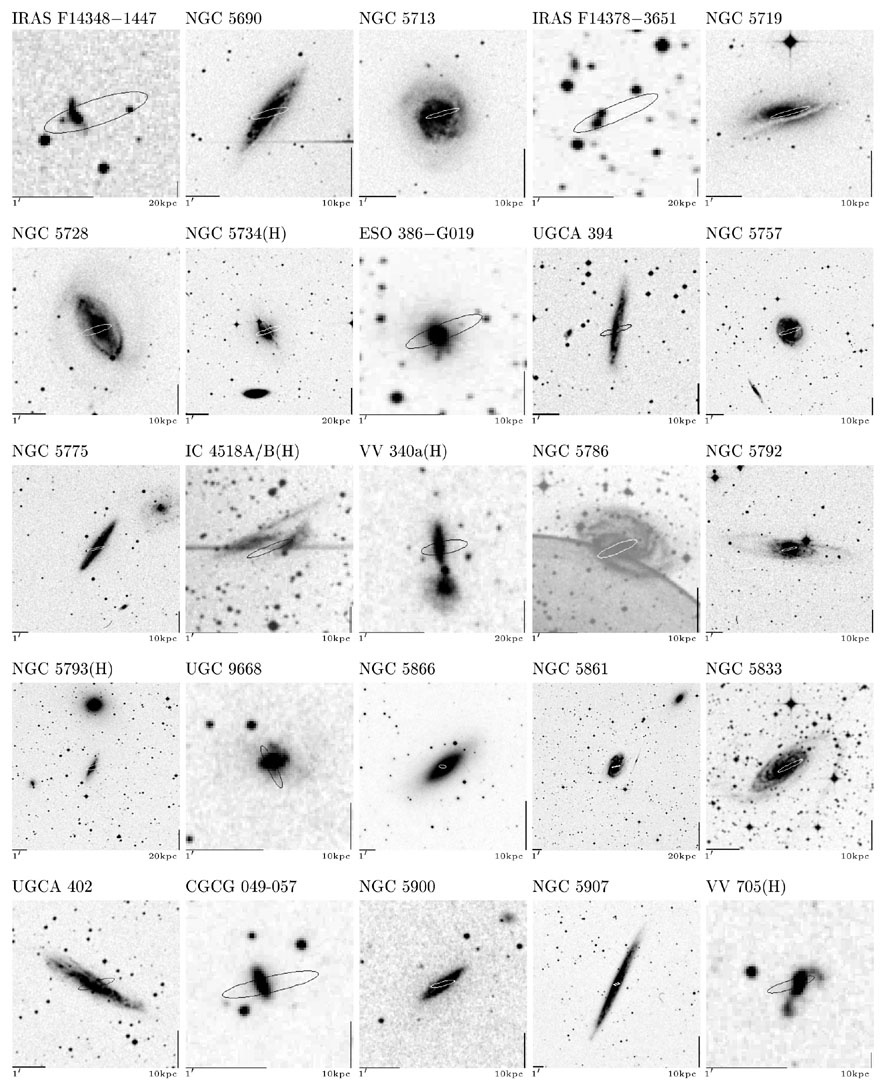 |
Figure 1. Continued (p. 20 of 26)
|
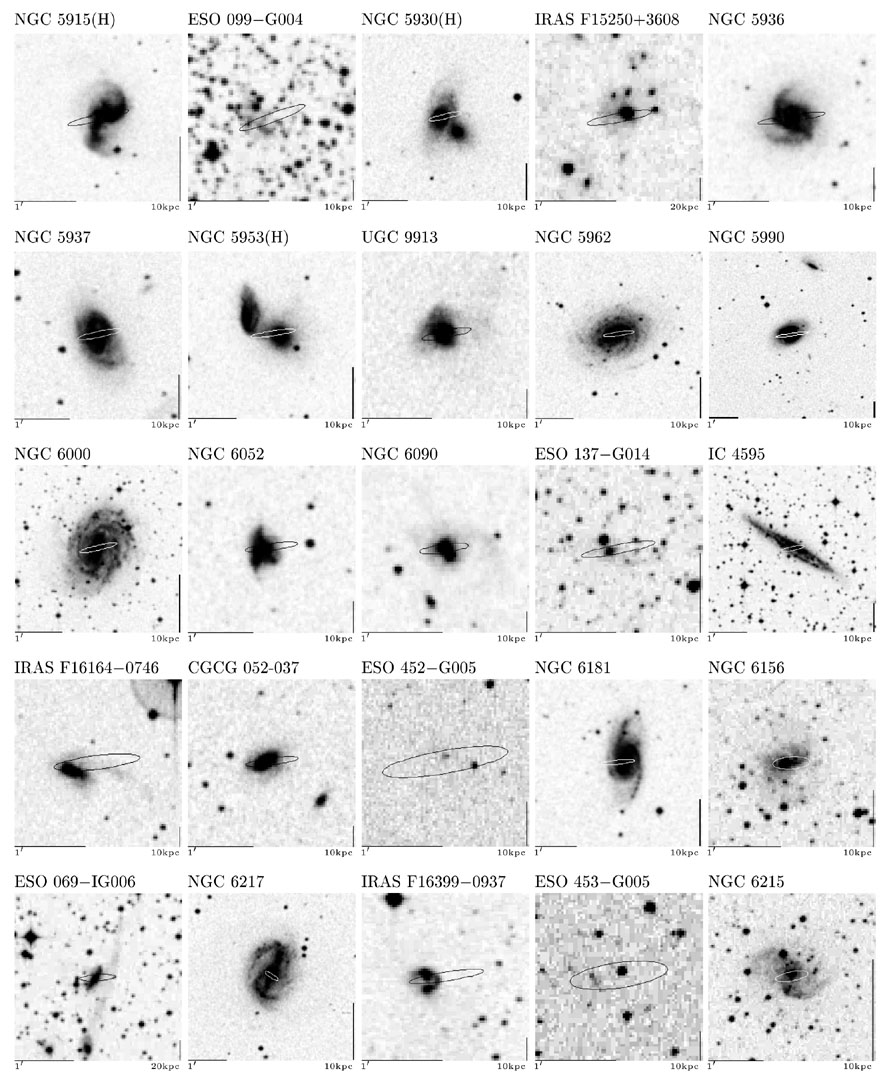 |
Figure 1. Continued (p. 21 of 26)
|
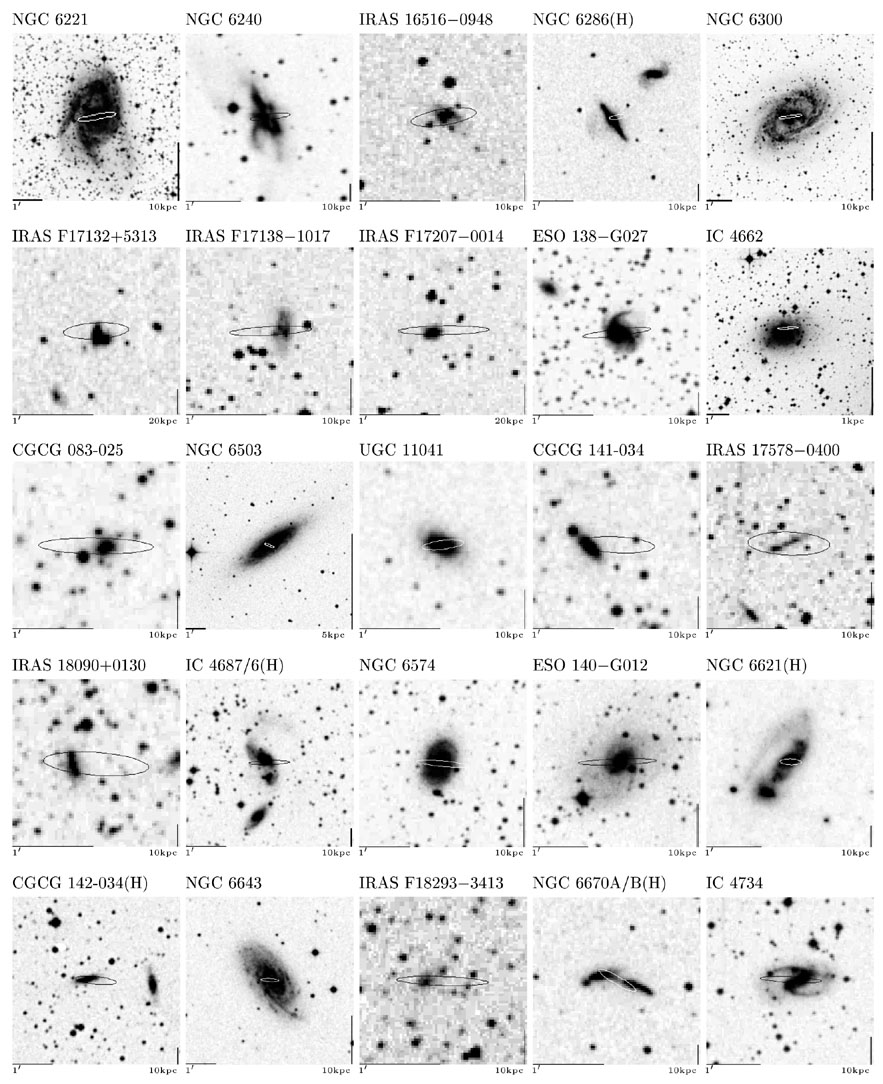 |
Figure 1. Continued (p. 22 of 26)
|
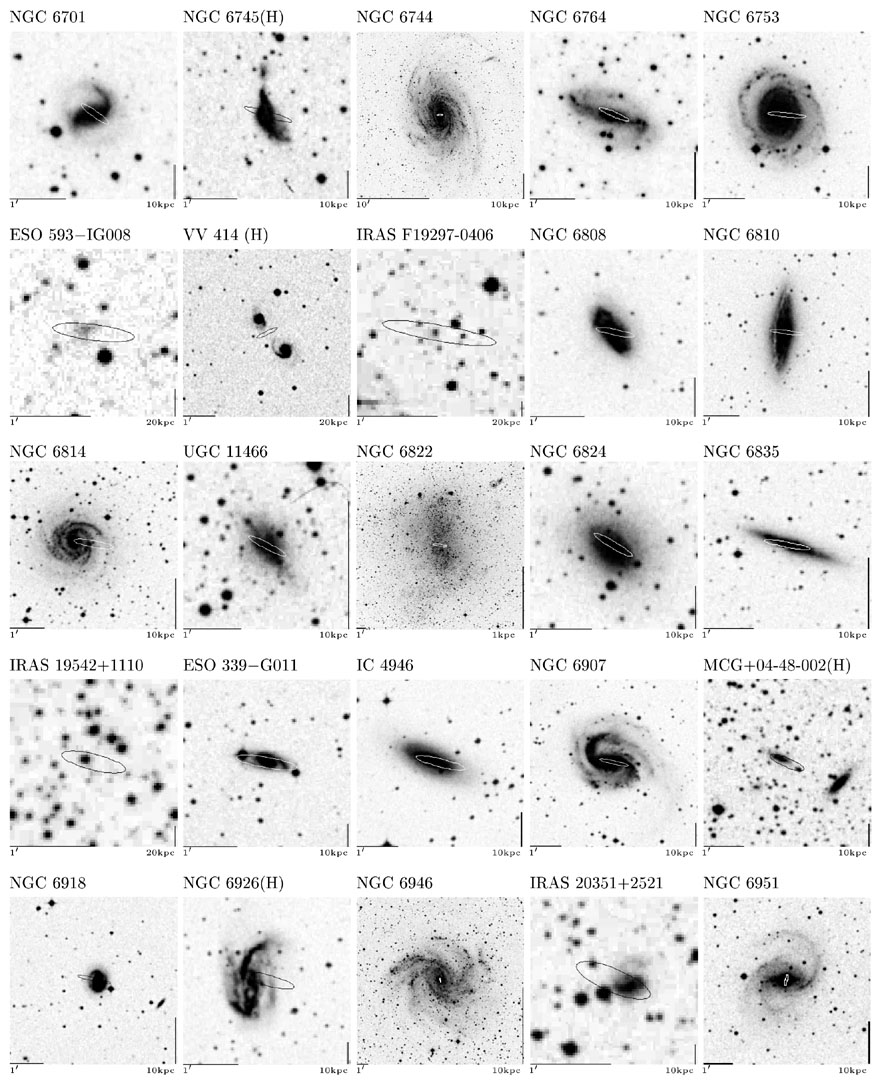 |
Figure 1. Continued (p. 23 of 26)
|
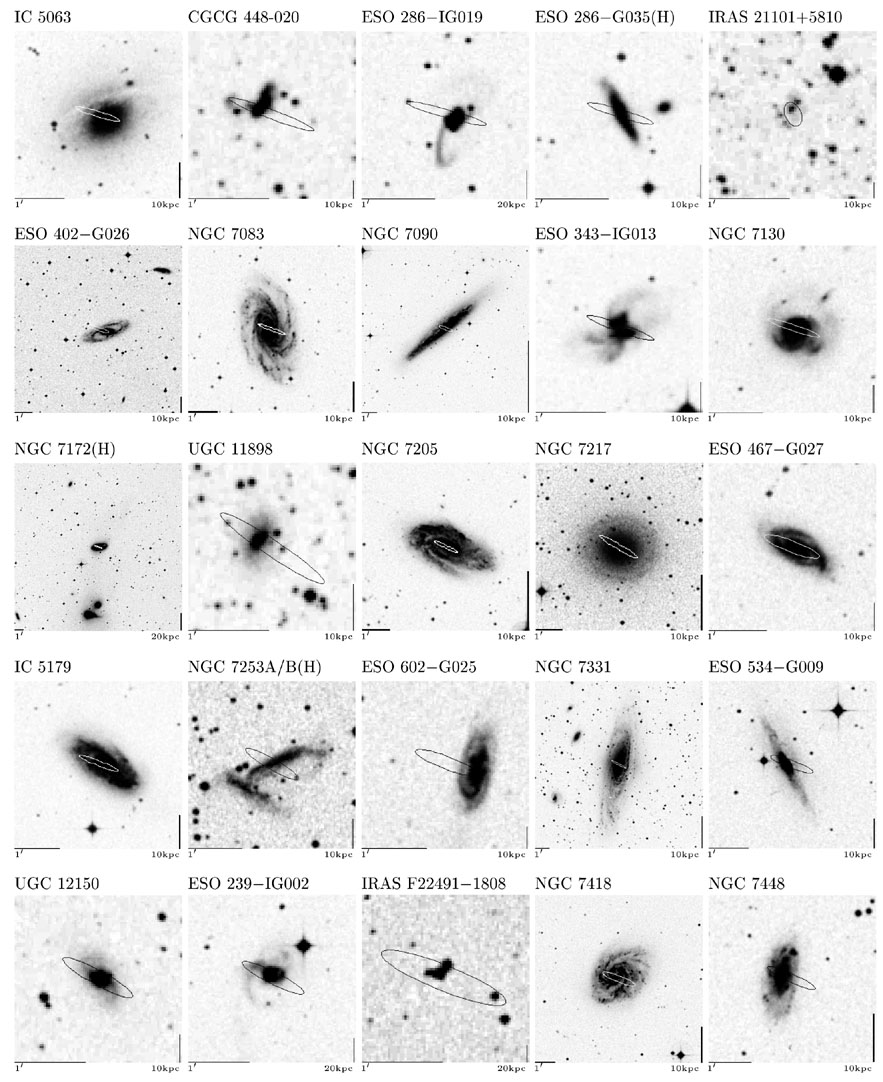 |
Figure 1. Continued (p. 24 of 26)
|
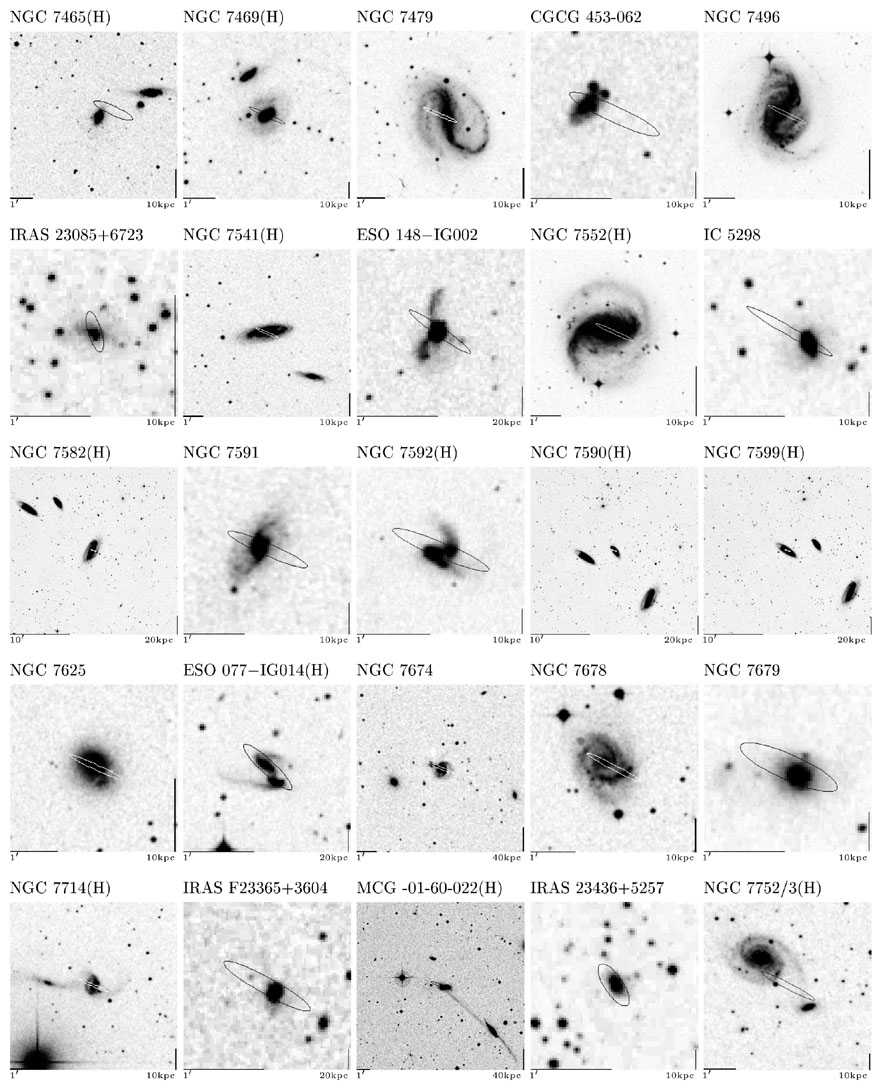 |
Figure 1. Continued (p. 25 of 26)
|
 |
Figure 1. Continued (p. 26 of 26)
|
10 The Digitized Sky Survey was produced at the Space Telescope Science Institute under U.S. Government grant NAG W-2166. The images of these surveys are based on photographic data obtained using the Oschin Schmidt Telescope on Palomar Mountain and the UK Schmidt Telescope. The plates were processed into the present compressed digital form with the permission of these institutions. Back.