


Schmidt et al. [86], using a sample of 16 SNII, estimated H0 = 73 ± 6 (statistical) ± 7 (systematic) using EPM. This estimate is independent of other rungs in the extragalactic distance ladder, the most important of which are the Cepheids, which currently calibrate most other distance methods (such as SNIa). The Cepheid and EPM distance scales, compared galaxy to galaxy, agree to within 5% and are consistent within the errors [16, 52]. This provides confidence that both methods are providing accurate distances.
The current nearby SNIa sample [24, 32, 41, 84] contains more than 100 objects (Fig. 3), and accurately defines the slope in the Hubble diagram from 0 < z < 0.1 to 1%. To measure H0, SNIa must still be externally calibrated with Cepheids, and this calibration is the major limitation to measuring H0 with SNIa. Two separate teams have analyzed the Cepheids and SNIa but have obtained divergent values for the Hubble constant. Saha et al. [88] find H0 = 59 ± 6, whereas Freedman et al. [20] find H0 = 71 ± 2 ± (6 systematic). Of the 12 SNIa for which there are Cepheid distances to the host galaxy (SN1895B*, SN1937C*, SN1960F*, SN1972E, SN1974G*, SN1981B, SN1989B, SN1990N, SN1991T, SN1998eq, SN1998bu, and SN1999by), four were observed by non-digital means (marked by *) and are best excluded from analysis on the grounds that non-digital photometry routinely has systematic errors far greater than 0.1 mag. Jha [41] has compared the SNIa distances using an updated version of MLCS to the Cepheid host galaxy distances measured by the two Hubble Space Telescope (HST) teams. Using only the digitally observed SNIa, he finds, using distances from the SNIa project of Saha et al. [88], H0 = 66 ± 3 ± (7 systematic) km s-1 Mpc-1. Applying the same analysis to the Key Project distances by Freedman et al. [20] gives H0 = 76 ± 3 ± (8 systematic) km s-1 Mpc-1. This difference is not due to SNIa errors, but rather to the different ways the two teams have measured Cepheid distances with. The two values do overlap when the systematic uncertainties are included, but it is still uncomfortable that the discrepancies are so large, particularly when some systematic uncertainties are common between the two teams.
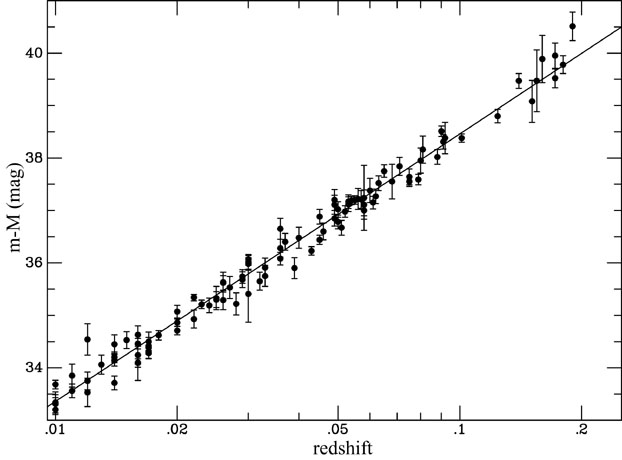 |
Figure 3. The Hubble diagram for SNIa from 0.01 > z > 0.2 [24, 33, 41, 84]. The 102 objects in this range have a residual about the inverse square line of ~ 10%. |
At present, SNe provide the most convincing constraints with H0 ~ 70 ± 10 km s-1 Mpc-1. However, future work on measuring H0 lies not with the SNe but with the Cepheid calibrators, or possibly in using other primary distance indicators such as EPM or the Sunyaev-Zeldovich effect.