


4.4. Dating the Star Formation Activity
Realistically, the detailed spectroscopic analysis
described above can only be applied to a subset
of LBGs, at the bright end of the luminosity funtion.
However, the coarser spectral energy distribution (SED) of Lyman break
galaxies still holds important
information on the star formation episodes.
Broad-band photometry in the optical and near-infrared,
spanning the wavelength interval 900-5500Å in the
rest-frame, is now available for more than one hundred
galaxies at z  3
(Papovich, Dickinson,
& Ferguson 2001;
Shapley et al. 2001).
The colours over this range (typically
four colours are used in the analysis) depend on the degree
of dust reddening, E(B - V),
and on the age of the stellar population, tsf.
The two can be decoupled with some degree of confidence
provided that the SED includes the age-sensitive Balmer break
near 3650Å, which at z = 3 falls between the H and
K bands - hence the need for accurate near-IR photometry.
A third parameter, the instantaneous star formation rate,
3
(Papovich, Dickinson,
& Ferguson 2001;
Shapley et al. 2001).
The colours over this range (typically
four colours are used in the analysis) depend on the degree
of dust reddening, E(B - V),
and on the age of the stellar population, tsf.
The two can be decoupled with some degree of confidence
provided that the SED includes the age-sensitive Balmer break
near 3650Å, which at z = 3 falls between the H and
K bands - hence the need for accurate near-IR photometry.
A third parameter, the instantaneous star formation rate,
 (tsf),
determines the normalisation (rather than the shape) of the SED.
The analyses by
Papovich et al. (2001)
and
Shapley et al. (2001)
deduced the best-fitting values of E(B - V),
tsf, and
(tsf)
by
(tsf),
determines the normalisation (rather than the shape) of the SED.
The analyses by
Papovich et al. (2001)
and
Shapley et al. (2001)
deduced the best-fitting values of E(B - V),
tsf, and
(tsf)
by  2
minimisation of the differences between the observed
SEDs and those predicted by the widely used population synthesis code of
Bruzual & Charlot
(1993
and subsequent updates). The results have turned out to be very
interesting - some would say surprising
(see Figures 28 and 29).
2
minimisation of the differences between the observed
SEDs and those predicted by the widely used population synthesis code of
Bruzual & Charlot
(1993
and subsequent updates). The results have turned out to be very
interesting - some would say surprising
(see Figures 28 and 29).
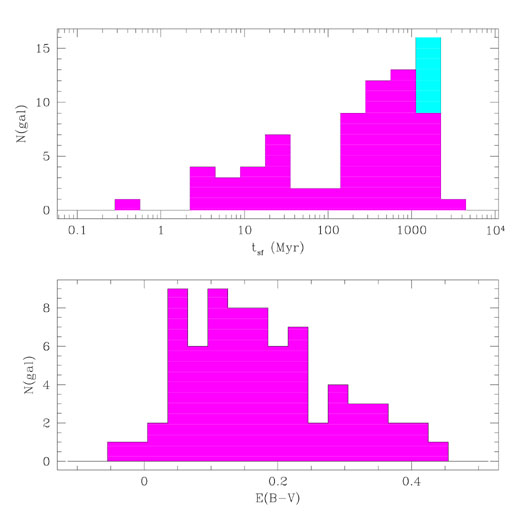 |
Figure 28. Histograms of best-fitting ages
and reddening for the sample of 81 z
|
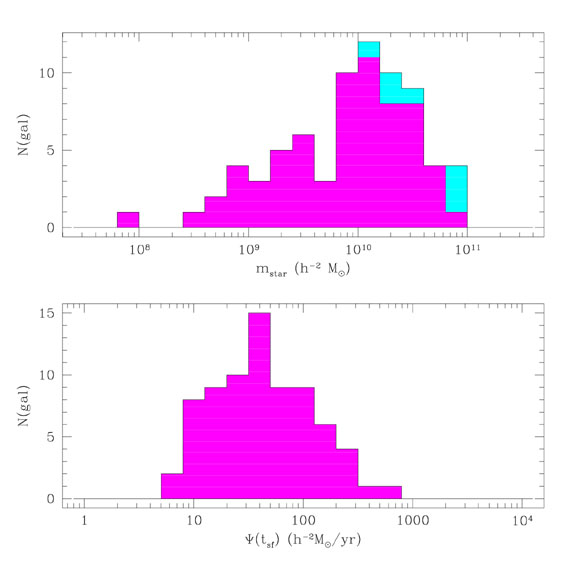 |
Figure 29. Histograms of assembled stellar
mass and star formation rates from
Shapley et al. (2001).
By redshift z
|
Evidently, Lyman break galaxies span a wide range of ages.
One fifth of the sample considered by
Shapley et al. (2001)
consists of objects which apparently have just collapsed
and are forming stars on a dynamical timescale
(~ 35 Myr). As we have seen, cB58 seems to belong to this class.
At the other end of the scale, some 20% of the galaxies
at z = 3 have been forming stars for more than 1 Gyr, placing
the onset of star formation at much higher redshifts (z > 5 - 10).
Furthermore, there appears to be a correlation between
age and star formation rate, with the younger objects
typically forming stars at about ten times the rate
of the older ones and being more reddened on average. The mean SFR is
<(tsf)> = 210h-2
M yr-1 for galaxies with tsf < 35Myr
while, for the 20% of the sample with tsf > 1 Gyr,
<(tsf)> = 25h-2
M
yr-1.
yr-1 for galaxies with tsf < 35Myr
while, for the 20% of the sample with tsf > 1 Gyr,
<(tsf)> = 25h-2
M
yr-1.
This range of properties is further reflected in the total
formed stellar masses mstar obtained by integrating
(tsf)
over tsf. A variety of star formation histories was
considered (e.g. star formation which is continuous or decreases with
time); in general mstar does not depend
sensitively on this choice, although
an older population of stars which by z
3
have faded at UV and optical wavelengths could remain hidden
(Papovich et al. 2001).
As can be seen from Figure 29, by redshift
z 3 some galaxies
had apparently already assembled a stellar mass
comparable to that of an L* galaxy today,
mstar
4 ×
1010
M,
while 20% of the sample have values of mstar
one order of magnitude smaller. These findings led
Shapley et al. (2001)
to speculate that we may be beginning to discern an
evolutionary sequence in Lyman break galaxies,
with the younger, dustier, more actively star-forming objects
evolving to the older, less reddened, and more quiescent
phase. It remains to be seen how this scenario
stands up to the scrutiny of future observations,
as we try to link the properties of the stellar populations
of individual galaxies to other parameters, such as
dynamical mass and metallicity.