Copyright © 1997 by Annual Reviews. All rights reserved
| Annu. Rev. Astron. Astrophys. 1997. 35:
101-136 Copyright © 1997 by Annual Reviews. All rights reserved |


This review concentrates on the basic behavior of the selection biases affecting classical photometric (or diametric) distance indicators, which will always have a central role when large numbers of galaxies are analyzed (morphological luminosity classification, TF, and Faber-Jackson relations). Large samples have the special advantage that one may investigate in detail their properties, completeness, and composition and recognize the relevant selection effects, and hence put the distance indicator on a safe basis.
Along with such major indicators, which are practical for large fundamental samples, there are more specialized methods that complement them, especially within the Local Supercluster, and may provide more accurate distances for a number of individual galaxies. If the distance scale that a "new generation" indicator erects significantly deviates from that obtained from the classical, carefully scrutinized methods, then the first task is to ask whether the new methods have some source of bias. As historically evidenced, distance indicators need sufficient time to mature, and in the long run all the methods, when better understood, should result in consistent distances. Such problems have been suspected in recent years, e.g. in the methods of planetary nebulae luminosity function (PNLF) and of surface brightness fluctuations, which have given systematically smaller distances than Cepheids in galaxies where comparison has been possible (Gouguenheim et al 1996, Tammann et al 1996). Generally, selection effects tend to bias true distances to incorrect smaller values. This rule seems to apply also to the method of PNLF when one attempts to extend it to galaxies in or beyond the Virgo cluster, though it may work very well for close galaxies (Bottinelli et al 1991).
The Hubble Space Telescope has given remarkable building
blocks for the distance ladder, especially by the measurement of many new
Cepheid distances for galaxies that can be used for calibrating secondary
distance indicators (e.g.
Freedman 1996,
Tammann et al 1996).
This allows different distance indicators to be based on roughly similar
sets of calibrating galaxies and, without intermediaries other than the
Hubble
law, allows comparison of the resulting distance scales. Differences should
then directly reflect problems in one or both of the methods. Presently,
there is one pair of distance indicators that can be usefully compared in
this way: supernovae of type Ia (SN Ia)
(Tammann et al
1996)
and the TF relation for D25 and B, as applied by
Theureau et al
(1997)
on the KLUN-sample. Figure 4 shows the data,
together with single Cepheid galaxies, on the µ-vs-log
Vo
diagram. The KLUN galaxies have been taken from the unbiased plateau of MND;
each symbol refers generally to an average of a few tens of galaxies. The
straight line corresponds to the Hubble law with Ho = 56
km/s/Mpc, which describes the distribution of individual Cepheid
galaxies, groups containing a Cepheid galaxy, TF galaxies, and the SN Ia
galaxies in the range of 25 < µ <
39. Rather than claiming that this diagram gives any final distance scale,
I show it as an encouraging sign of how different distance indicators begin
to give consistent results when special attention is paid to the problem
of selection bias. It should be noted that SN Ia, with their small
dispersion  ,
high luminosity, and detection requirements that are not solely dictated
by the maximum luminosity magnitude, are expected to be little affected by
the Malmquist bias of the second kind in the distance range shown.
,
high luminosity, and detection requirements that are not solely dictated
by the maximum luminosity magnitude, are expected to be little affected by
the Malmquist bias of the second kind in the distance range shown.
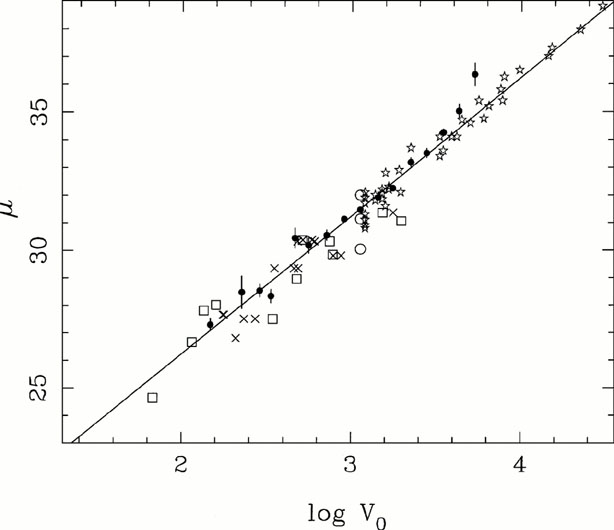 |
Figure 4. Three distance indicators and the Hubble law are illustrated: SN Ia (stars), the B-magnitude TF distance moduli µ from the unbiased plateau of the normalized distance method (dots: averages of several galaxies), and Cepheids used for calibrating the supernovae method and the TF relation (crosses: individual Cepheid-galaxies, squares: groups containing a Cepheid-galaxy). Supernovae data are from Tammann et al (1996) and TF data from Theureau et al (1997). Radial velocity Vo is corrected for the Virgo-centric velocity field. The Hubble line corresponds to Ho = 56 km/s/Mpc. |
It has been said that "cosmology is a study of selection effects" (Baryshev, private communication). This view of what cosmologists are doing may seem a little too dull; nevertheless, there is a deep truth in it, too. It should be an intimate part of the methodology to try to recognize different kinds of selection effects when one attempts to build an unbiased picture of the universe (leaving aside the profound question whether such an enterprise is ultimately at all possible). Often in the forefront of scientific discoveries, one rather likes to ignore selection effects because in order to positively identify these, one should have enough collected data, and this rarely happens in the avant-garde phase. Also, selection effects sometimes produce apparent phenomena that, if true, would certainly be more interesting than the mechanisms of selection and bias that naturally attract less attention.
Another point worthy of emphasis is that the selection biases do not vanish anywhere, even though the astronomical data are accumulated beyond old magnitude limits. Problems are shifted towards larger distances and fainter magnitudes, and new generations of astronomers have to learn how the biases reappear.
Acknowledgments
I am very much indebted to my French colleagues and friends, L Bottinelli, L Gouguenheim, G Paturel, and G Theureau. Collaboration with them always has been pleasant and we have learned much about the Malmquist bias by inspecting together their large and wonderful galaxy samples. I thank my young Finnish collaborators, T Ekholm and M Hanski, for help with the figures included in this review. I am very grateful to A Sandage for several useful suggestions. My teacher in extragalactic astronomy was Toivo Jaakkola (1941-1995). I wish to dedicate this article to his memory.