


In many ways, the empirical exploration of the assembly of stellar mass throughout cosmic history has been one of the defining features of the last decade of extragalactic astronomical effort. Yet, in spite of such effort, and the apparent simplicity of the goal, progress at times has been frustratingly slow. The difficulties are many: calibration of SF rate (SFR) and stellar mass indicators, the effects of dust on SFR estimates, relatively poor sensitivity for most SFR indicators, and field-to-field variations caused by large scale structure. In this section, I will briefly summarize the progress made to date towards measuring the cosmic SF history (SFH) using two independent methods: exploration of the evolution of the cosmic-averaged SFR, and the evolution of the cosmic-averaged stellar mass density, both as a function of epoch. The two are intimately related - the cosmic SFH is the integral over the cosmic SFR - and, barring any strong variation in stellar initial mass functions (IMFs) as a function of galaxy properties and/or epoch, consistency between the two would be expected.
2.1. The cosmic-averaged star formation rate density
One measures SFR by measuring galaxy luminosities in a passband or passbands which one hopes will reflect the total number of massive stars in a galaxy. Using stellar population synthesis and other models, one then attempts to convert this luminosity into a total SFR, assuming a given stellar IMF to allow conversion from the number of massive stars to the total mass in the newly-formed stellar population (see, e.g., [Kennicutt (1998)] for an excellent review).
In some cases, this calibration from total luminosity to SFR is relatively robust, because it relies on reasonably well-understood physics. For example, the total ultraviolet (UV) light from a galaxy is reasonably robustly translated into the number of massive O and B stars. The total infrared luminosity of a starbursting galaxy, if the galaxy is optically-thick to the UV light, is a reasonable reflection of the bolometric output of this starburst. Balmer line emission, under weak assumptions about the physical conditions in HII regions, is a reasonable indicator of the number of very massive O stars. These quantities, in turn, can be converted into a total SFR, assuming a stellar IMF which does not depend on galaxy properties and epoch.
In other cases, the calibration from luminosity to SFR is much less direct: e.g., the GHz radio emission from star-forming galaxies is well-correlated with other indicators of SFR, such as IR or Balmer line luminosity, and is known to be dominated by synchrotron emission from cosmic-ray electrons spiraling in galactic magnetic fields for at least massive star-forming galaxies (see [Condon (1992)] for an excellent review; see also [Bell (2003)]). Yet, there is no robust theoretical understanding of why the relationship between radio emission and SFR should show such modest scatter (see, e.g., [Bressan, Silva, & Granato (2002), Niklas & Beck (1997), Lisenfeld, Völk, & Xu (1996)] for models of the radio emission of star-forming galaxies).
On top of these interpretive challenges, there are other,
equally or more important difficulties. Dust extinguishes UV light very
effectively; empirical dust corrections based
on UV color and/or UV-optical properties calibrated on UV-bright
starbursts in the local Universe
([Calzetti, Kinney,
& Storchi-Bergmann (1994),
Calzetti (2001)])
do not apply to normal galaxies
([Bell (2002),
Kong et al. (2004)]),
IR-bright starbursts
([Goldader et
al. (2002)]),
or indeed even HII regions
([Bell et al. (2002),
Gordon et
al. (2004)]).
Estimates of dust reddening from Balmer line ratios may yield
reasonably accurate Balmer line-derived SFRs for galaxies
([Kennicutt
(1983)]),
yet are extremely challenging to measure at
z  0.4. IR
and radio facilities lack the sensitivity to
probe to faint limits; only galaxies with SFRs in excess of
~ 10 M
0.4. IR
and radio facilities lack the sensitivity to
probe to faint limits; only galaxies with SFRs in excess of
~ 10 M yr-1 are observable with current facilities at
z 0.5 (e.g.,
[Flores et
al. (1999)]).
yr-1 are observable with current facilities at
z 0.5 (e.g.,
[Flores et
al. (1999)]).
There are a huge number of papers which have addressed the evolution of the cosmic SFR, and are too numerous to mention or discuss in any detail. A few particularly important examples are [Lilly et al. (1996)], [Madau et al. (1996)], [Flores et al. (1999)], [Steidel et al. (1999)], and [Haarsma et al. (2000)].
In Fig. 1, I show the general form of the cosmic SFR, as derived by [Hopkins (2004)] in a very nice compilation of cosmic SFR estimates, where he uses locally-calibrated relationships between dust attenuation and SFR to correct for dust. His corrections are reasonably similar to those commonly used, but with the important advantages that they are uniformly derived, and account for the well-known SFR-dust correlation. The intention of showing this cosmic SFR is primarily to illustrate that despite the significant observational challenges and interpretive challenges it has been possible to determine its broad shape to better than a factor of three over much of cosmic history, using a variety of different observational methodologies.
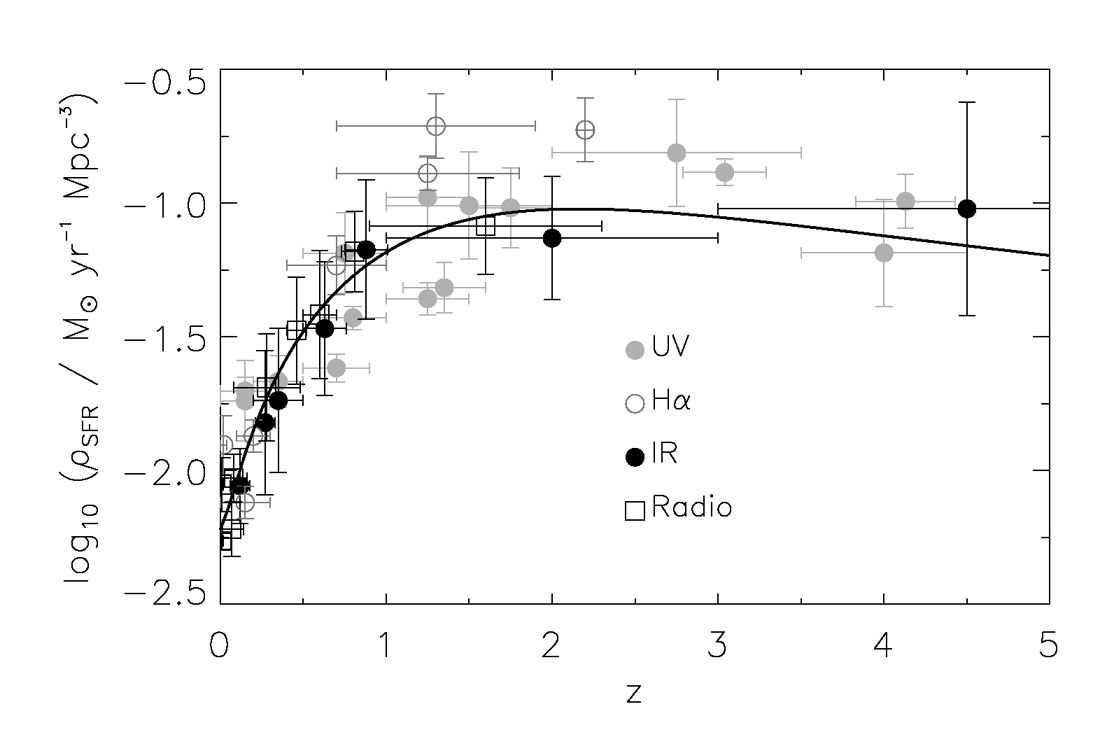 |
Figure 1. The evolution of the cosmic SFR density. SFRs assume a [Kroupa (2001)] IMF and H0 = 70 km s-1 Mpc-1. The data are taken from [Hopkins (2004)], and are corrected for dust assuming a SFR-dust correlation as found in the local Universe. The solid line shows an empirical fit to the cosmic SFR. |
There are two points which one should take away from the
cosmic SFR, both of which have been known at least at the qualitative level
since 1996 when the first cosmic SFRs were constructed (e.g.,
[Lilly et al. (1996),
Madau et al. (1996)]).
Firstly, it is abundantly clear that the cosmic SFR has dropped by a
factor of nearly 10 since
z ~ 1.5 (see, e.g., the interesting compilation from
[Hogg (2001)]).
Secondly, there is no compelling evidence
against a roughly constant cosmic SFR at redshifts higher than 1 (e.g.,
[Steidel et
al. (1999)]),
with the exception of some recent explorations of UV-derived
SFRs at
z 4, which
appear to be lower than those at
z  4 (e.g.,
[Stanway et
al. (2004)]).
4 (e.g.,
[Stanway et
al. (2004)]).