


4.1. Future Prospects for Chandra and XMM-Newton
Future prospects for learning more about AGN physics and evolution via X-ray
surveys appear wonderful! Follow-up studies for most of the
 40
surveys listed in Table 1 and
Table 2 are ongoing, and many
exciting results
are thus guaranteed even if no more X-ray data are taken. Fortunately,
however, both Chandra and XMM-Newton continue to generate
torrents of superb new data that can provide even more impressive advances.
40
surveys listed in Table 1 and
Table 2 are ongoing, and many
exciting results
are thus guaranteed even if no more X-ray data are taken. Fortunately,
however, both Chandra and XMM-Newton continue to generate
torrents of superb new data that can provide even more impressive advances.
Where can the capabilities of Chandra and XMM-Newton be
best applied in future observations?
Figure 12 presents one useful way of thinking
about this issue, via a plot of 0.5-2 keV flux limit versus solid angle for
selected X-ray surveys. Key parts of this diagram remain to be explored.
For example, very little solid angle has been surveyed at 0.5-2 keV
flux levels of (2-20)
× 10-17 erg cm-2 s-1, and thus
our understanding of the X-ray universe at these flux levels suffers from
limited source statistics and likely cosmic variance. These
flux levels are below the XMM-Newton confusion limit, and thus
multiple 0.25-2 Ms Chandra observations are required. Specific
science goals that can be advanced with this approach include
(1) pinning down the X-ray luminosity function of moderate-luminosity
AGN at z 2-6,
(2) tracing AGN clustering out to high redshift; this is ideally
done with contiguous, deep coverage, and
(3) measuring the evolution and properties of groups and low-luminosity
clusters out to z
1.
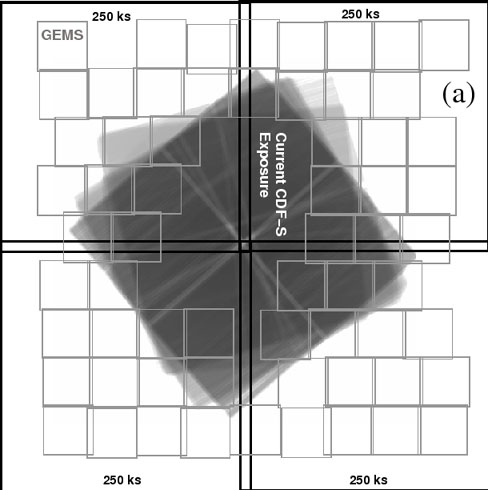
Figure 13a depicts the ongoing Extended
Chandra Deep Field-South
survey, which has been guided by the philosophy above. It will
cover a contiguous ~ 1/4 deg2 area at a 0.5-2 keV flux level
of (1-2) × 10-16 erg cm-2 s-1, and
it should generate
400 new AGN (in
addition to the
300 already
known in the CDF-S). Almost all of these will have superb HST imaging
and multiwavelength coverage.
 |
Figure 12. A selection of extragalactic
X-ray surveys in the 0.5-2 keV flux limit versus solid angle,
|
An equally important guiding philosophy is to observe one field with
Chandra
as sensitively as possible (see Figure 12).
Reaching 0.5-2 keV flux levels of
5 ×
10-18 erg cm-2 s-1
is entirely feasible; Chandra could remain nearly
photon limited near the field center (see
Figure 13b), and source confusion is
unlikely even for source densities exceeding 100,000 deg-2.
The total required exposure time on a field is
10 Ms. Specific
science goals include (1) determining if there is a significant population
of Compton-thick AGN at
z 0.5-4 that
has been missed to date
(see Section 3.1), (2) tightening
constraints on moderate-luminosity AGN at
z 4-10, (3)
detecting hundreds of normal and starburst galaxies
out to high redshift (these should outnumber the AGN), and
using their X-ray emission as an independent,
extinction-free measure of star-formation rate, and (4) obtaining
significant numbers of X-ray photons on the faint X-ray source populations
currently known, so that X-ray spectral and variability analyses can be
applied effectively to determine their nature. Such a sensitive X-ray
observation will not be possible again for 10-20 years (see
Figure 14)!
Performing such an observation now can provide information on the sources
that will be the primary targets of future missions such as XEUS
and Generation-X; it will thereby bolster the science cases for
these missions and aid their optimal design.
 |
 |
Figure 13. (a) Schematic
illustration of the Extended Chandra Deep
Field-South survey. The underlying grayscale image shows the current
CDF-S exposure map. The four large black squares show the coverage
of the upcoming four 250 ks Chandra observations. The 63 small
gray squares show the coverage of HST ACS observations made by the
GEMS project (the GOODS survey provides HST ACS coverage for the
central region not covered by GEMS).
(b) Chandra 0.5-2 keV image of the central part of the 2 Ms CDF-N
centered on the HDF-N (shown in outline). Note that most
( |
|
 , plane. Shown are
the ROSAT All-Sky Survey (RASS),
the Einstein Extended Medium-Sensitivity Survey (EMSS),
the ROSAT International X-ray/Optical Survey (RIXOS),
the XMM-Newton Serendipitous Surveys (XMM Bright,
XMM Medium, XMM Faint),
the Chandra Multiwavelength Project (ChaMP),
the ROSAT Ultra Deep Survey (ROSAT UDS),
the
, plane. Shown are
the ROSAT All-Sky Survey (RASS),
the Einstein Extended Medium-Sensitivity Survey (EMSS),
the ROSAT International X-ray/Optical Survey (RIXOS),
the XMM-Newton Serendipitous Surveys (XMM Bright,
XMM Medium, XMM Faint),
the Chandra Multiwavelength Project (ChaMP),
the ROSAT Ultra Deep Survey (ROSAT UDS),
the