


The summary figure for understanding the galaxy structure-redshift relationship is Figure 2. This relationship can be summarized simply as: At higher redshifts (early times) the fraction of bright galaxies that are peculiar in structure and morphology increases gradually at the expense of both spirals and ellipticals.
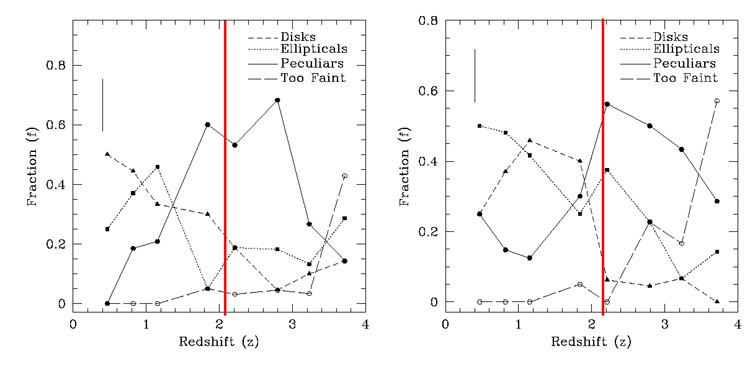 |
Figure 2. This figure shows the evolution in relative fractions of different galaxy types as a function of redshift for classifications in the I814 (left panel) and H160 (right panel) band images of the HDF-N. The short vertical solid line on each plots gives the average error for these fractions. The long vertical line is the redshift limit for detecting spirals and ellipticals with MB < - 20. Types plotted are: disks (short dashed), ellipticals (dotted), peculiars (solid) and galaxies which are too faint for a classification (long dashed). |
The final state of galaxy evolution surrounds us, and the modern universe is dominated by galaxies that can be classified on the Hubble sequence. A large fraction of all modern massive and bright galaxies are either ellipticals or spirals; only roughly 1-2% of all bright galaxies with MB < - 20 can be classified as peculiars (e.g., Marzke et al. 1998) (see Table 1). This changes gradually with redshift up to z ~ 1 and then more rapidly between 1 < z < 2; at z ~ 1 most galaxies have relaxed morphologies while at z ~ 2 most galaxies are peculiar (Conselice et al. 2004b; Table 1).
| Redshift | Ellipticals | Spirals | Peculiars |
| 0.0 | 6.41 ± 0.01 | 6.98 ± 0.01 | 5.34 ± 0.03 |
| 0.5 | 6.3 ± 0.2 | 6.6 ± 0.1 | 5.7 ± 0.2 |
| 0.8 | 6.3 ± 0.2 | 6.2 ± 0.2 | 5.4 ± 0.3 |
| 1.0 | 6.4 ± 0.2 | 6.5 ± 0.2 | 6.1 ± 0.2 |
| 1.2 | 6.2 ± 0.2 | 6.1 ± 0.2 | 5.7 ± 0.3 |
| 1.3 | 6.0 ± 0.2 | 5.9 ± 0.2 | 6.3 ± 0.2 |
| 1.5 | 5.7 ± 0.2 | ... | 5.4 ± 0.3 |
| 1.6 | ... | 5.4 ± 0.3 | 5.7 ± 0.3 |
| 1.7 | 5.4 ± 0.3 | 5.7 ± 0.2 | 6.1 ± 0.2 |
| 1.9 | 5.7 ± 0.2 | 5.4 ± 0.4 | 5.7 ± 0.3 |
| 2.0 | 5.9 ± 0.2 | 6.1 ± 0.2 | 6.4 ± 0.1 |
a Galaxies at z = 0 are taken from the "Third Reference Catalogue of Bright Galaxies" (de Vaucouleurs et al. 1991). The other galaxy densities at z > 0 are an average between the densities found for each type in the Hubble Deep Fields North and South. |
|||