


3.4. Galaxy Structures at High Redshift z > 2
The structures and morphologies of galaxies at z > 2 are just now being studied in detail. Early work in this area suggested that galaxies selected by the Lyman-break technique have compact structures with outer light envelopes (Giavalisco et al. 1996). These compact structures have half-light radii a few kpc in size, similar to the bulges of modern spirals or moderate luminosity spheroids. Many of these compact galaxies have steep light profiles and asymmetrically distributed outer nebulosity. The depth of this early imaging was quickly superseded by the Hubble Deep Field North which showed a rich diversity of galaxy structures (Figure 5; Ferguson, Dickinson & Williams 2000). The morphologies of these galaxies is still however a largely unexplored area of parameter space.
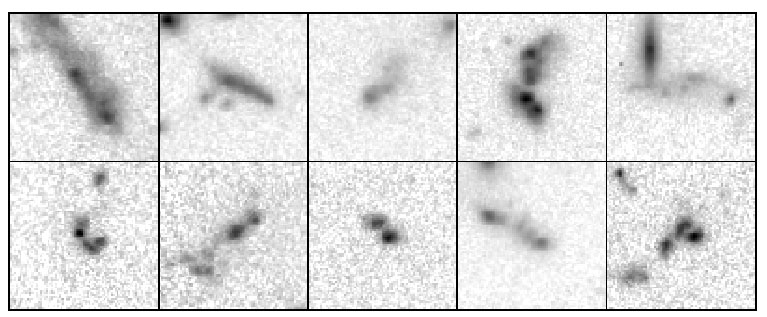 |
Figure 5. The morphologies of bright galaxies, mostly at z > 2, in the Hubble Deep Field North showing the peculiar and non-compact structures of these galaxies, many with several bright central regions or knots. |
One of the reasons the morphologies of z > 2 galaxies have not
been
studied in detail is that describing their structures is not a trivial
problem, as very few galaxies at high redshift can be identified as
objects that would fit on the Hubble Sequence (e.g.,
Giavalisco et al. 1996;
Conselice et al. 2003a;
Lotz et al. 2003).
One way to approach this problem
is to use a purely descriptive approach described above, while
another is to use quantitative techniques to characterize these
structures. The has been done in
Conselice et
al. (2003a) and
Conselice et
al. (2004b)
for galaxies at z > 2. The CAS systems
shows that at the highest redshifts there is a real dichotomy in the
galaxy population such that the most luminous and most massive galaxies
are consistent with undergoing a major merger based on CAS indices,
particularly the asymmetry index
(Conselice et
al. 2003a).
What is found is that half of all bright, MB < - 21 or
massive M* > 1011
M galaxies are
actively undergoing a major merger. The fainter and
lower mass galaxies have peak merger fractions at z ~ 2.5 that
are only 20%, or lower. The relative fraction of mergers declines at
lower redshifts very quickly for these massive and luminous galaxies
as power law
galaxies are
actively undergoing a major merger. The fainter and
lower mass galaxies have peak merger fractions at z ~ 2.5 that
are only 20%, or lower. The relative fraction of mergers declines at
lower redshifts very quickly for these massive and luminous galaxies
as power law  (1 +
z)3-5
(Conselice et
al. 2003).
A comparison to hierarchical assembly models of galaxies is shown in
Figure 6 using GALFORM
simulations (e.g.,
Benson et al. 2002).
These models over-predict the number of major mergers occurring for
the brightest galaxies at z < 1, consistent with the fact that
there are too many bright K-band selected galaxies at z ~ 1 - 1.5
than predicted in Cold Dark Matter based models
(Somerville et
al. 2004;
see also Section 4.3).
(1 +
z)3-5
(Conselice et
al. 2003).
A comparison to hierarchical assembly models of galaxies is shown in
Figure 6 using GALFORM
simulations (e.g.,
Benson et al. 2002).
These models over-predict the number of major mergers occurring for
the brightest galaxies at z < 1, consistent with the fact that
there are too many bright K-band selected galaxies at z ~ 1 - 1.5
than predicted in Cold Dark Matter based models
(Somerville et
al. 2004;
see also Section 4.3).
 |
Figure 6. Left panel: major merger fractions to z ~ 3 at magnitude limits MB = - 21 and -19. Semi-analytical model predictions are also shown. Right panel: Stellar mass accretion history from major mergers as a function of initial mass (see Conselice et al. 2003a). |