

Our understanding of the origin and evolution of the Universe has been fundamentally transformed with seminal redshift, distant supernovae and cosmic microwave background surveys. The focus has shifted to the distribution and nature of dark matter and dark energy that drive the dynamics of the expanding cosmos. The study of the local Universe, including its peculiar motions and its clustering on scales exceeding 100 Mpc, is an essential ingredient in the connection between the origin of structure in the early Universe and the subsequent formation of galaxies and their evolution to the state we observe today. Key issues include the location and velocity distribution of galaxies, leading to the mass-to-light relationship between what is observed and what is influencing the mass density field.
Spurred on by the enormous success of the redshifts surveys (cf. Huchra et al 1983), conducted some 20 years ago, pioneers such as CfA's John Huchra proposed to image the entire sky at near-infrared wavelengths to create an unbiased census of galaxies that would fuel the next generation of redshift surveys (e.g., 6dFGS; see Watson et al 2001 and Jones et al 2004) and help address these weighty issues. After much deliberation, what finally transpired some ten years ago now, is the Two Micron All Sky Survey (2MASS). Many years of observations and hard work to detect and extract sources has produced a gap-free image atlas of entire sky, and catalogues containing stars and galaxies. The 2MASS view of the sky - the spatial distribution of galaxies in the local Universe - is the focus of this paper. Figure 1 is an attempt to encapsulate our present understanding of the large scale structure that embodies the local Universe.
 |
Figure 1. Panoramic view of the entire near-infrared sky reveals the distribution of galaxies beyond the Milky Way. The image is derived from the 2MASS Extended Source Catalog (XSC) - more than 1.5 million galaxies, and the Point Source Catalog (PSC) - nearly 0.5 billion Milky Way stars. The galaxies are color coded by "redshift," photo- metrically deduced from the K band (2.2 µm) or as given in the NASA Extragalactic Database (NED). Blue are the nearest sources (z < 0.01); green are at moderate distances (0.01 < z < 0.04) and red are the most distant sources that 2MASS resolves (0.04 < z < 0.1). The map is projected with an equal area aitoff in the Galactic system (Milky Way at center). A key to this projection is given in Figure 2. |
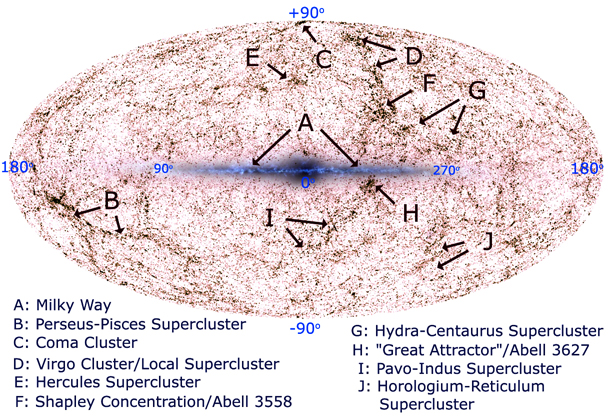 |
Figure 2. Galactic projection of the 2MASS Galaxy Catalog. Galaxy clusters and large scale structures are labeled. The complete projection in shown in Figure 1. |