


2.2. Bars and Seyfert activity
Seyferts are almost ideal for a study of AGN host galaxies: they are relatively local and occur predominantly in disk galaxies (see Fig. 2 for a nice example). One of the aspects of the host galaxy - Seyfert activity connection that has received a good deal of attention over the years is the question of whether Seyfert hosts are more often barred than non-Seyferts. Starting with the work of Adams (1977), many authors have dedicated efforts to resolve this question, without finding conclusive evidence (e.g., Adams 1977; Simkin, Su, & Schwarz 1980; Balick & Heckman 1982; MacKenty 1990; Moles, Márquez, & Pérez 1995; Ho et al. 1997; Crenshaw, Kraemer, & Gabel 2003). Unfortunately, many of these investigations are plagued by the absence of a properly matched control sample, by the use of the RC3 classification or, worse perhaps, ad-hoc and non-reproducible classification criteria to determine whether a galaxy is barred; and all of them are based on optical imaging.
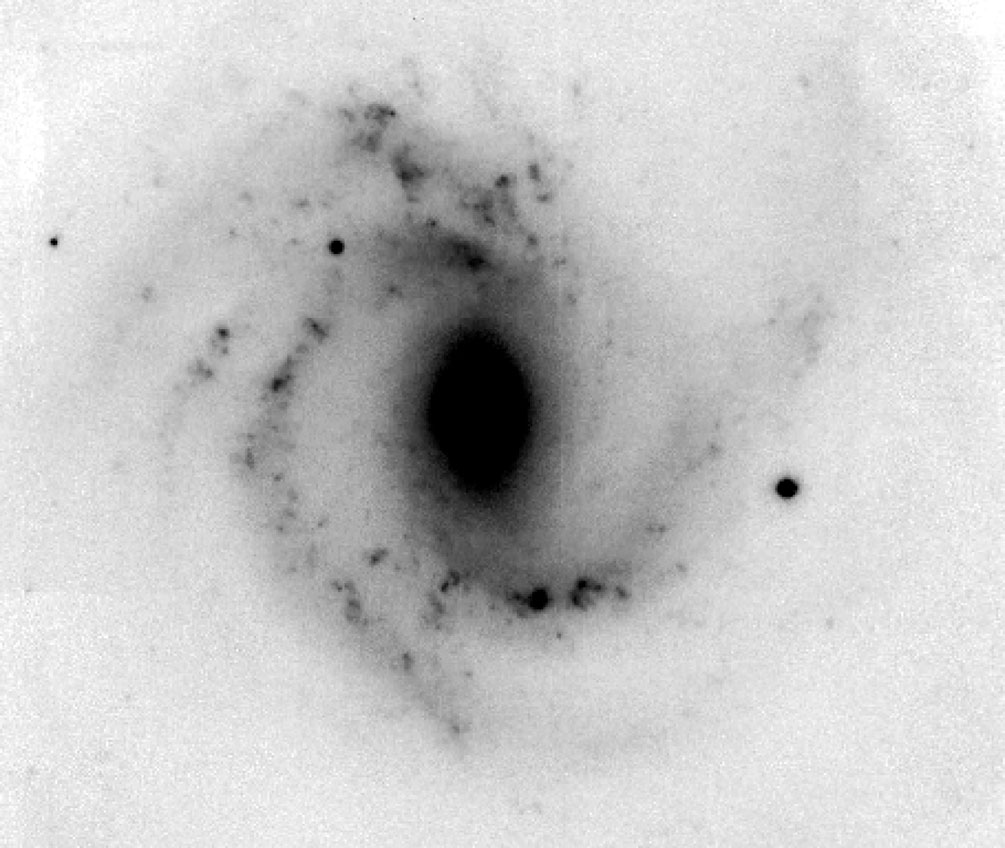 |
Figure 2. Near-IR Ks image of the Seyfert host galaxy NGC 4303, showing a prominent bar and a well-structured set of spiral arms. North is up, East to the left, and the size of the image shown is approximately four minutes of arc. The image was taken with the INGRID camera on the William Herschel Telescope, see Knapen et al. (2003) for more details. |
Near-IR imaging is much better suited for finding bars (see Section 2.1), and a small number of studies have combined the use of high-quality, near-IR imaging with careful selection and matching of samples of Seyfert and quiescent galaxies. One such study, by Mulchaey & Regan (1997), reports identical bar fractions, but Knapen, Shlosman, & Peletier (2000), using imaging at higher spatial resolution and a rigorously applied set of bar criteria, find a marginally significant difference, with a higher bar fraction in a sample of CfA Seyferts than in a control sample of non-Seyferts (approximately 80% vs. 60%). The results found by Mulchaey & Regan (1997) can be reconciled with those reported by Knapen et al. (2000) by considering the lower spatial resolution employed by the former authors.
Laine et al. (2002)
later confirmed this difference at a 2.5
 level by increasing the sample size and using high-resolution HST
NICMOS near-IR images of the central regions of all their active
and non-active sample galaxies.
Laine et al. (2002)
also found that
almost one of every five sample galaxies, and almost one of every
three barred galaxies, has more than one bar. The nuclear bar
fraction, however, is not enhanced in Seyfert galaxies as compared to
non-Seyferts (see also
Erwin & Sparke 2002).
level by increasing the sample size and using high-resolution HST
NICMOS near-IR images of the central regions of all their active
and non-active sample galaxies.
Laine et al. (2002)
also found that
almost one of every five sample galaxies, and almost one of every
three barred galaxies, has more than one bar. The nuclear bar
fraction, however, is not enhanced in Seyfert galaxies as compared to
non-Seyferts (see also
Erwin & Sparke 2002).
In a recent paper,
Laurikainen, Salo &
Buta (2004)
study the bar properties of some 150 galaxies from the Ohio State
University Bright Galaxy Survey
(Eskridge et al. 2002)
in terms of their nuclear
properties, among other factors. Using several bar classification
methods on optical and near-IR images, they find that only a Fourier
method applied to near-IR images leads to a significant excess of bars
among Seyferts/LINERs as compared to non-active galaxies: a bar
fraction of 71% ± 4% for the active/starburst galaxies, versus
55% ± 5% for the non-active galaxies (at a significance level of
2.5)
1.
The Fourier method employed by Laurikainen et al. (2004) is objective but sensitive largely to classical bars with high surface brightnesses, and in this respect similar to the strict criteria applied by Knapen et al. (2000) and Laine et al. (2002), who basically rely upon significant a rise and fall in a radial ellipticity profile for bar identification. The results of the Fourier analysis by Laurikainen et al. (2004) are remarkably similar to those from Knapen et al. and Laine et al., apparently because all trace prominent bars in near-IR images. Laurikainen et al. find that the excess of bars among Seyferts/LINERs does not manifest itself in an analysis of optical images, which agrees with the general lack of excess found by the many authors who relied upon optical imaging for their bar classification (see references above). Laurikainen et al. (2004) also find that the bars in active galaxies are weaker than those in non-active galaxies, a result which confirms earlier indications to this effect by Shlosman, Peletier & Knapen (2000) and by Laurikainen, Salo, & Rautiainen (2002).
We can thus conclude that there is a slight, though significant, excess of bars among Seyfert galaxies as compared to non-active galaxies. This result is found only when using near-IR images, and only when applying rigorous and objective bar classification methods. Even so, there remain important numbers of active galaxies without any evidence for a bar, and, on the other hand, many non-active galaxies which do have apparently suitable bars. Given that any fuelling process must be accompanied by angular momentum loss, most easily achieved by gravitational non-axisymmetries, either the timescales of bars (or interactions, see below) are different from those of the activity, or the non-axisymmetries are not as easy to measure as we think, for instance because they occur at spatially unresolvable scales, and could be masqueraded to a significant extent by, e.g., dust or star formation (Laine et al. 2002), or because they occur in the form of weak ovals (e.g., Kormendy 1979) which will not necessarily be picked up by ellipse fitting or Fourier techniques. Additional work is clearly needed, but it is not clear whether this should be aimed primarily at the large-scale bars described in this Section, or perhaps better at the kinematics and dynamics of the very central regions of active and non-active galaxies. In any case, the use of carefully matched samples and control samples is of paramount importance.
1 It is an interesting exercise to add
the numbers found by
Laurikainen et al. (2004)
to those found by
Laine et al. (2002),
which would give largely the same overall result in terms
of bar fractions, but with smaller error bars thanks to the increased
sample sizes, and an overall significance level of more than
3. Formally this is not
allowed though because the original
samples have been selected using different methods, and should not
simply be added.
Back.