


2.2. HI Morphology
To study the distribution of HI in the LMC on small scales requires many pointings to cover the LMC at high angular resolution. Kim et al. (1998) used the Australia Telescope Compact Array (ATCA) to obtain a map that is sensitive on scales of 15-500 pc. On these scales, the morphology is dominated by HI filaments with numerous shells and holes. The turbulent and fractal nature of the ISM on these scales is the result of dynamical feedback into the ISM from star formation processes. In the context of the present review we are more interested in the large scale distribution of HI gas. This issue has been studied for decades, including work by McGee & Milton (1966), Rohlfs et al. (1984) and Luks & Rohlfs (1992). Most recently, Staveley-Smith et al. (2003) obtained the map shown in Figure 3, using a multibeam survey with the Parkes telescope. This map is sensitive to spatial structure in the range 200 pc to 10 kpc. The HI distribution is very patchy (see also Kim et al. 2003, who combined the data of Kim et al. [1998] and Staveley-Smith et al. [2003] into a single map that is sensitive to structures on all scales down to 15 pc). The HI in the LMC is not centrally concentrated and the brightest areas are several degrees from the center. The overall distribution is approximately circular and there is no sign of a bar. All of these characteristics are strikingly different from the stellar distribution shown in Figure 2.
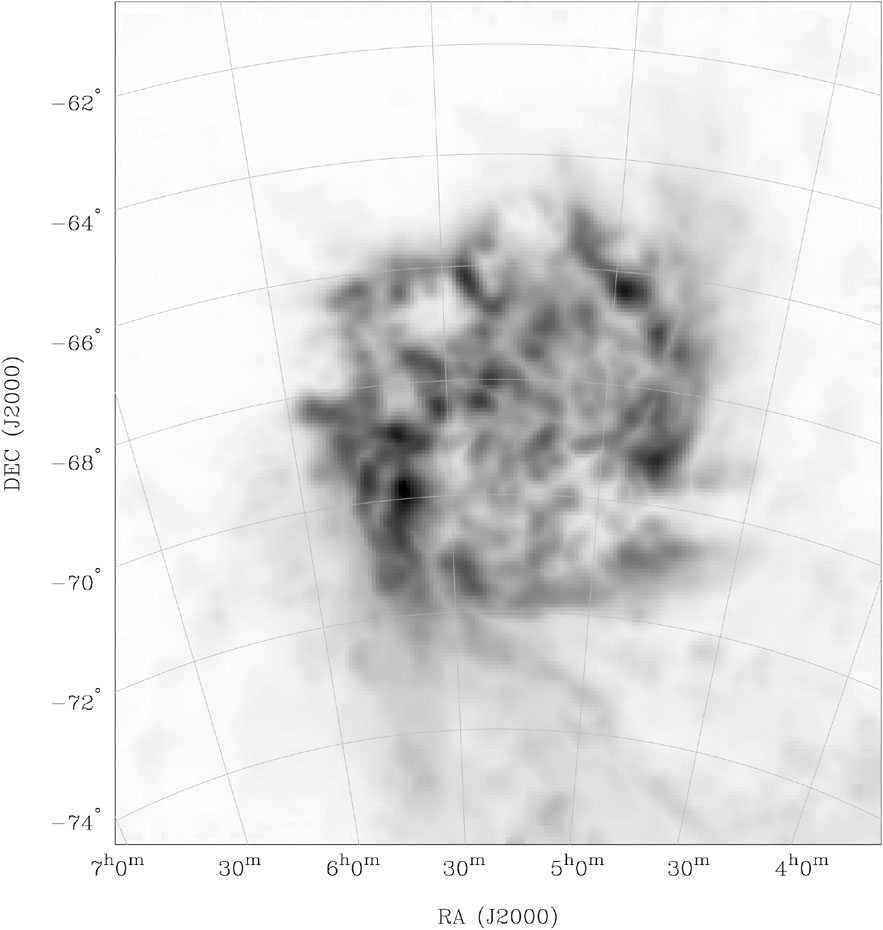 |
Figure 3. Peak brightness temperature image of HI in the LMC from Staveley-Smith et al. (2003). The data are from a Parkes multibeam survey and are sensitivity to spatial structure in the range 200 pc to 10 kpc. The orientation is the same as in Figure 2, but the present image covers an area that is approximately 2.5 times smaller (i.e., 1.6 in each dimension). |
Figure 4 shows contours of the HI distribution on a somewhat larger scale, from the HIPASS data presented in Putman et al. (2003), overlaid on the LMC near-IR star count map from Figure 2. This comparison suggests that collisionless tracers such as RGB and AGB stars are best suited to study the structure and mass distribution of the LMC disk, whereas HI gas may be better suited to study the effects of tidal interactions. The stream of gas towards the right of Figure 4 is the start of the Magellanic Bridge towards the SMC, which provides one of the many pieces of evidence for strong tidal interactions between the LMC, the Milky Way and the SMC.
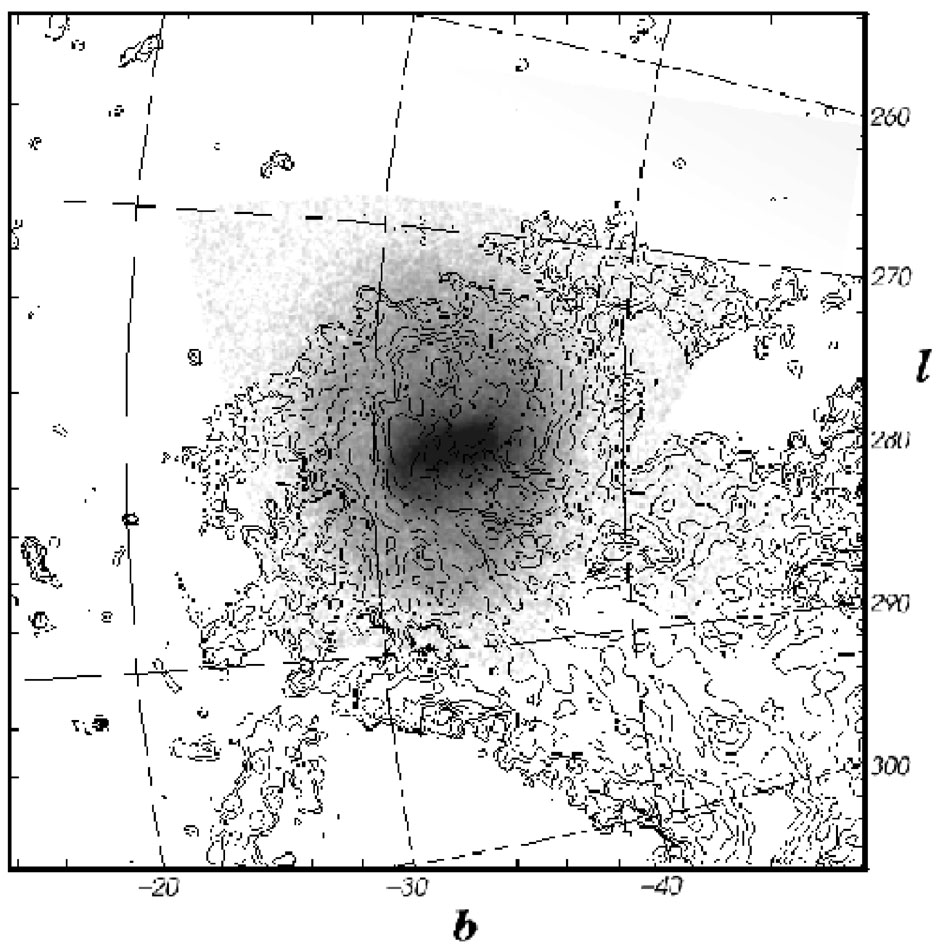 |
Figure 4. Contours of HI column density from Putman et al. (2003) overlaid on the LMC near-IR star count map from Figure 2. This figure is in Galactic coordinates, but (l, b) are shown so as to allow easy comparison with Figures 2 and 3. North is 9° clockwise from the vertical direction on the page. The image covers an area that is approximately 2.5 times larger than Figure 2 (i.e., 1.6 times in each dimension). The figure was kindly provided by M. Putman. |