


2.1. Thermal Sunyaev-Zel'dovich Effect
The SZE is a small spectral distortion of the CMB spectrum caused by the
scattering of the CMB photons off a distribution of high-energy
electrons. We only consider the SZE caused by the hot thermal
distribution of electrons provided by the ICM
of galaxy clusters. CMB photons passing through the center of a
massive cluster have a
 e
e
 0.01 probability of
interacting with an energetic ICM electron. The resulting inverse-Compton
scattering preferentially boosts the energy of the CMB photon,
causing a small (
0.01 probability of
interacting with an energetic ICM electron. The resulting inverse-Compton
scattering preferentially boosts the energy of the CMB photon,
causing a small ( 1 mK) distortion in the CMB spectrum. To illustrate the small effect,
Figure 1 shows the SZE spectral distortion for a
fictional cluster that is over 1000 times more massive than a typical
cluster. The SZE appears as a decrease
in the intensity of the CMB at frequencies below
218 GHz and
as an increase at higher frequencies.
1 mK) distortion in the CMB spectrum. To illustrate the small effect,
Figure 1 shows the SZE spectral distortion for a
fictional cluster that is over 1000 times more massive than a typical
cluster. The SZE appears as a decrease
in the intensity of the CMB at frequencies below
218 GHz and
as an increase at higher frequencies.
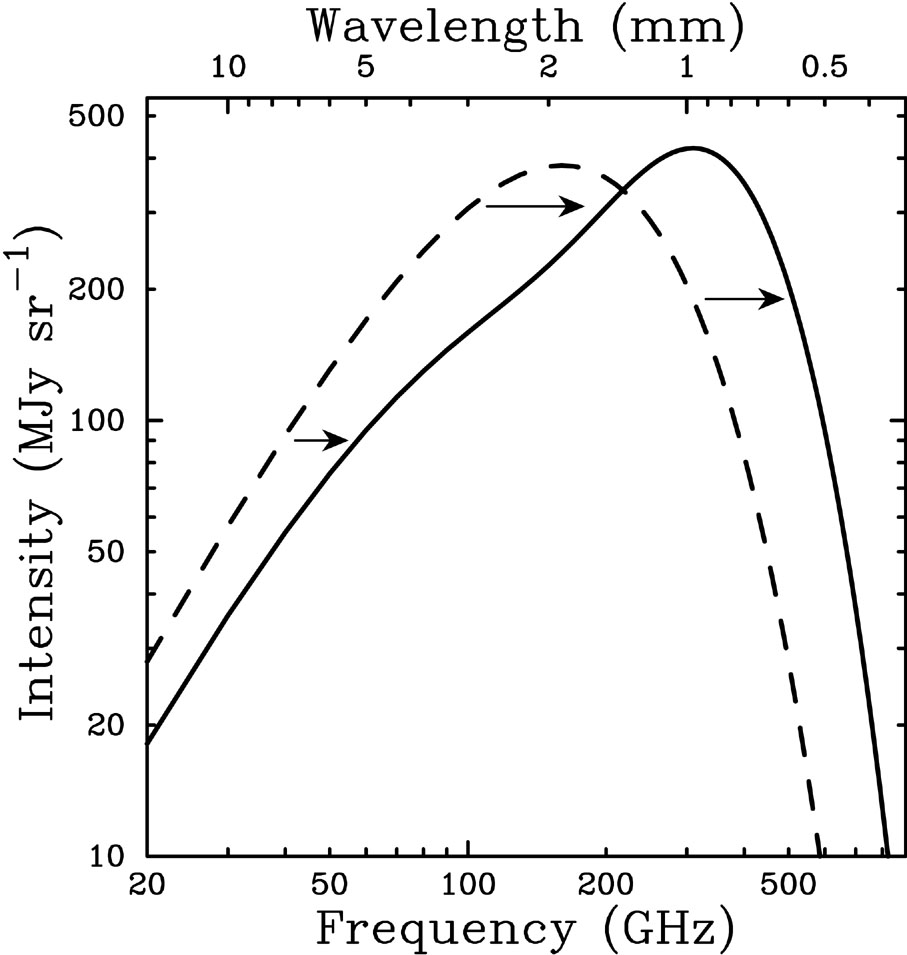 |
Figure 1. The CMB spectrum, undistorted
(dashed line) and distorted by the SZE (solid line). Following
Sunyaev & Zel'dovich
(1980),
to illustrate the effect, the SZE
distortion shown is for a fictional cluster 1000 times more massive than a
typical massive galaxy cluster. The SZE causes a decrease in the CMB
intensity at frequencies
|
The SZE spectral distortion of the CMB, expressed as a
temperature change
 TSZE
at dimensionless frequency
x
TSZE
at dimensionless frequency
x  (h
(h
 ) / (kB
TCMB), is given by
) / (kB
TCMB), is given by
 |
(1) |
where y is the Compton y-parameter, which for an isothermal
cluster equals the optical depth times the fractional energy gain per
scattering. Here,
 T is the
Thomson cross-section, ne is the
electron number density, Te is the electron
temperature, kB is the
Boltzmann's constant, me c2 is the
electron rest-mass energy, and the integration is along the line of
sight. The frequency dependence of the SZE is
T is the
Thomson cross-section, ne is the
electron number density, Te is the electron
temperature, kB is the
Boltzmann's constant, me c2 is the
electron rest-mass energy, and the integration is along the line of
sight. The frequency dependence of the SZE is
 |
(2) |
where
 SZE(x,
Te) is the relativistic correction to the
frequency dependence. Note that
f (x)
SZE(x,
Te) is the relativistic correction to the
frequency dependence. Note that
f (x)  -2 in the nonrelativistic and Rayleigh-Jeans (RJ) limits.
It is worth noting that
TSZE
/ TCMB is independent of
redshift, as shown in Equation 1. This unique feature of the
SZE makes it a potentially powerful tool for investigating the
high-redshift Universe.
Expressed in units of specific intensity, common in millimeter SZE observations, the thermal SZE is
 |
(3) |
where I0 = 2(kB TCMB)3 / (hc)2 and the frequency dependence is given by
 |
(4) |
TSZE
and
ISZE
are simply related by the
derivative of the blackbody with respect to temperature,
|dB /
dT|.
The spectral distortion of the CMB spectrum by the thermal SZE is
shown in Figure 2 (solid line) for a realistic
massive cluster (y = 10-4), in units of intensity
(left panel) and RJ brightness temperature (right panel). The RJ
brightness is shown because the sensitivity of a radio telescope is
calibrated in these units. It is defined simply by
I =
(2kB
2 /
c2)TRJ, where
I is the
intensity at frequency ,
kB is Boltzmann's constant, and c is the speed
of light. The CMB blackbody spectrum,
B(TCMB), multiplied by 0.0005 (dotted
line), is also shown for comparison. Note that the spectral signature
of the thermal effect is distinguished readily from a simple
temperature fluctuation of the CMB. The kinetic SZE distortion is
shown by the dashed curve (Section 2.2). In
the nonrelativistic regime, it is indistinguishable from a CMB
temperature fluctuation.
 |
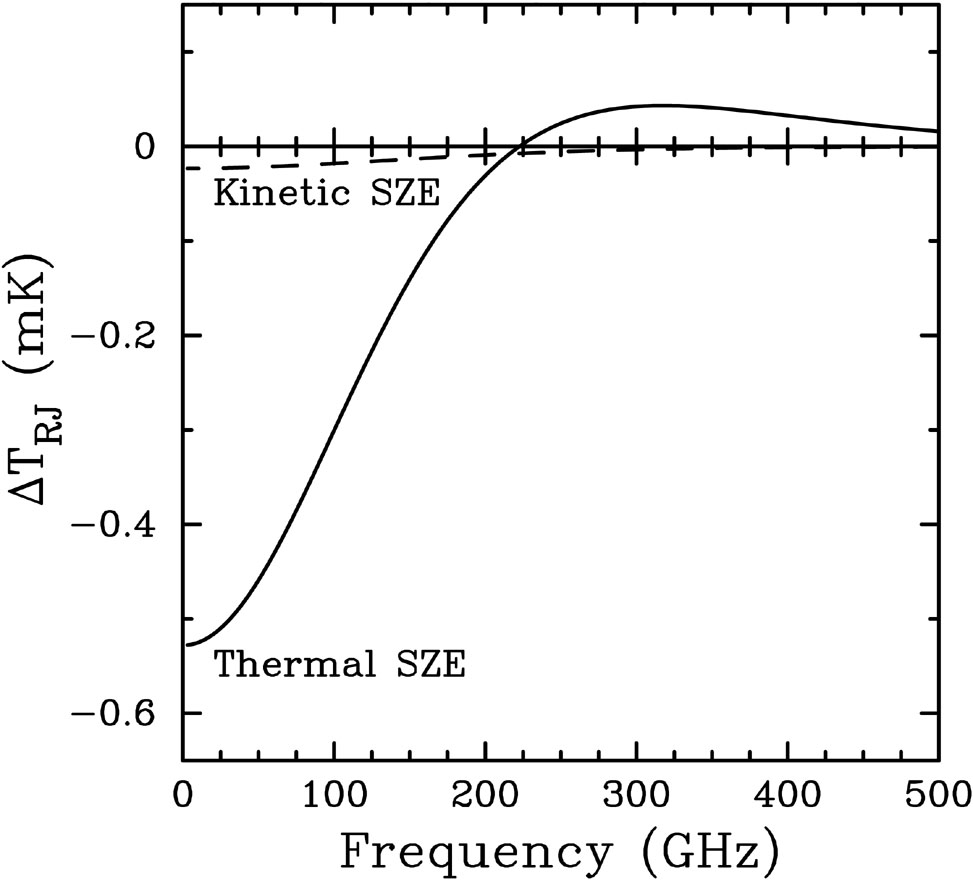 |
Figure 2. Spectral distortion of the CMB radiation due to the SZE. The top panel shows the intensity, and the bottom panel shows the Rayleigh-Jeans brightness temperature. The thick solid line is the thermal SZE, and the dashed line is the kinetic SZE. For reference the 2.7 K thermal spectrum for the CMB intensity, scaled by 0.0005, is shown by the dotted line in the left panel. The cluster properties used to calculate the spectra are an electron temperature of 10 keV, a Compton y-parameter of 10-4, and a peculiar velocity of 500 km s-1. |
The gas temperatures measured in massive galaxy clusters are around
kB Te
10 keV
(Mushotzky &
Scharf, 1997;
Allen & Fabian,
1998)
and are measured to be as high as ~ 17 keV in the galaxy cluster 1E
0657 - 56
(Tucker et al.,
1998).
At these temperatures, electron
velocities are becoming relativistic, and small corrections are
required for accurate interpretation of the SZE. There has been
considerable theoretical work to include relativistic corrections to
the SZE
(Rephaeli &
Yankovitch, 1997;
Molnar &
Birkinshaw, 1999;
Challinor &
Lasenby, 1998;
Challinor &
Lasenby, 1999;
Itoh et al., 1998;
Fabbri, 1981;
Wright, 1979;
Dolgov et al.,
2001;
Nozawa et al.,
1998b;
Rephaeli, 1995;
Sazonov &
Sunyaev, 1998a;
Stebbins, 1997;
Sazonov &
Sunyaev, 1998b).
All of these derivations agree for
kB Te
15 keV,
appropriate for galaxy clusters. For a massive cluster with
kBTe
10 keV
(kB Te / me
c2
0.02), the relativistic corrections to the SZE
are of order a few percent in the RJ portion of the spectrum, but can
be substantial near the null of the thermal effect. Convenient
analytical approximations to fifth order in
kB Te / me
c2 are presented in
Itoh et al. (1998).
The measured SZE spectrum of Abell 2163, spanning the decrement and increment with data obtained from different telescopes and techniques, is shown in Figure 3 (LaRoque et al., 2003; Holzapfel et al., 1997a; Désert et al., 1998). Also plotted is the best-fit model (solid) consisting of thermal (dashed) and kinetic (dotted) SZE components. The SZE spectrum is a good fit to the data, demonstrating the consistency and robustness of modern SZE measurements.
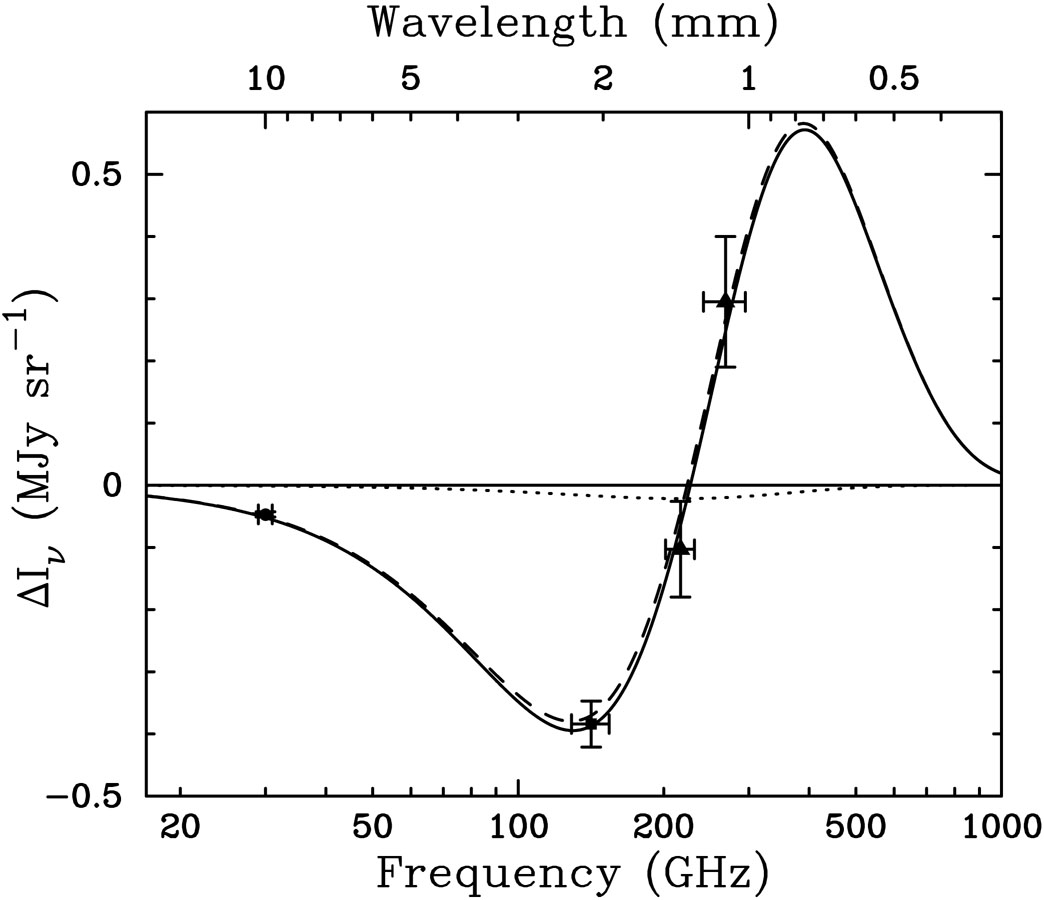 |
Figure 3. The measured SZE spectrum of
Abell 2163. The data point at 30 GHz is from BIMA
(LaRoque et al.,
2003),
at 140 GHz is the weighted average of Diabolo and SuZIE measurements
(filled square;
Holzapfel et
al. 1997a;
Désert et
al. 1998),
and at 218 GHz and 270 GHz
from SuZIE (filled triangles;
Holzapfel et
al. 1997a).
Uncertainties are at 68% confidence with the FWHM of the observing
bands shown. The best-fit thermal and kinetic SZE spectra are
shown by the dashed line and the dotted lines, respectively, with
the spectra of the combined effect shown by the solid line. The
limits on the Compton y-parameter and the peculiar velocity are
y0 = 3.71+0.36+0.33-0.36-0.16
× 10-4 and
|
The most important features of the thermal SZE are:
(1) it is a small spectral distortion of the CMB, of order ~ 1 mK,
which is proportional to the cluster pressure integrated along the line
of sight (Eq. 1); (2) it is independent of redshift; and
(3) it has a unique spectral signature with a decrease in the
CMB intensity at frequencies
218 GHz and an
increase at higher frequencies.
 p =
320+880+480-740-440 km s-1, respectively,
with statistical followed by systematic uncertainties at 68% confidence
(
p =
320+880+480-740-440 km s-1, respectively,
with statistical followed by systematic uncertainties at 68% confidence
(