


2.6. Luminosity and Redshift Effects
The SED described above is representative of local, optically selected
quasars. Here we summarize the evidence for luminosity or redshift
dependence in the emission of quasars.
The optical and UV spectra of quasars observed with HST and the
SDSS show no evidence of a dependence on redshift or luminosity.
On the other hand, the optical-to-X-ray ratio
 OX shows
clear evidence of a luminosity or redshift dependence in optically
selected samples
(Zamorani et al. 1981;
Avni & Tananbaum
1982,
1986;
Wilkes et al. 1994;
Yuan et al. 1998;
Bechtold et al. 2003;
Vignali et al. 2003).
Yuan et al. (1998)
discussed the reality of
this effect in the ROSAT sample and concluded that the
luminosity and/or redshift dependence could be due to selection
effects, provided that the intrinsic dispersion in the X-ray emission
of quasars is greater than in the optical.
OX shows
clear evidence of a luminosity or redshift dependence in optically
selected samples
(Zamorani et al. 1981;
Avni & Tananbaum
1982,
1986;
Wilkes et al. 1994;
Yuan et al. 1998;
Bechtold et al. 2003;
Vignali et al. 2003).
Yuan et al. (1998)
discussed the reality of
this effect in the ROSAT sample and concluded that the
luminosity and/or redshift dependence could be due to selection
effects, provided that the intrinsic dispersion in the X-ray emission
of quasars is greater than in the optical.
The latest results from the SDSS
(Vignali et al. 2003),
however,
strengthen the observational evidence for a dependence. The statistical
analyses performed on the SDSS quasars
(Vignali et al. 2003)
and on the sample of optically selected quasars observed with
ROSAT
(Yuan et al. 1998)
suggest that the dependence is only on
luminosity and not on redshift. However, it remains difficult
to disentangle the dependence on redshift and luminosity, which
are strongly correlated in flux-limited samples.
In Figure 7, we show the
OX-luminosity
correlation for a sample of SDSS quasars
observed (mostly serendipitously) with ROSAT and Chandra
(Vignali et al. 2003).
The best-fit linear correlation is
OX = -0.11
× log
L (2500
Å) + 1.85.
(2500
Å) + 1.85.
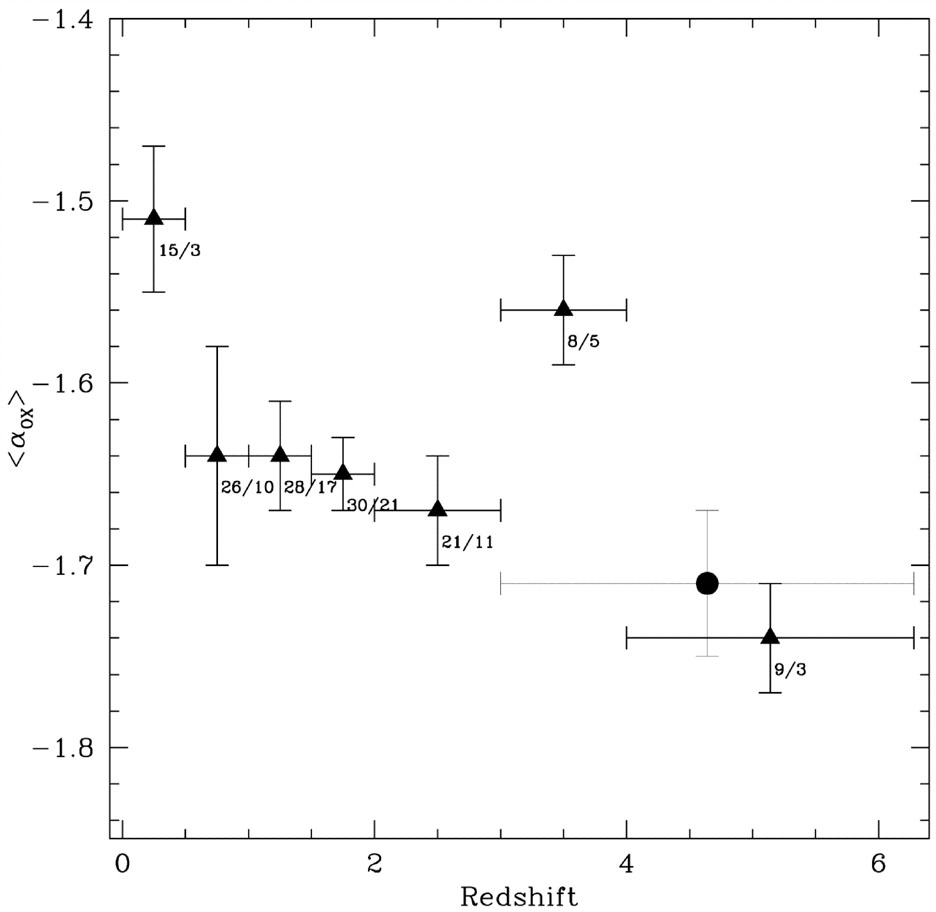 |
Figure 7. Dependence of
|
The dependence of the IR emission of quasars on luminosity is much
harder to estimate, mainly because of the possible contribution from
star formation. In Figure 6b,
we plot the
distribution of the IR-to-bolometric ratio for the same sample
as Figure 6a, but for
two luminosity ranges:
LIR < 3 × 10¹²
L (shaded histogram) and
LIR > 3 × 10¹²
L
(open histogram).
Apparently, higher luminosity sources have, on average, a smaller
fraction of their emission in the IR.
Haas et al. (2003)
concluded that most of the observed emission is due to the AGN. The same
conclusion was reached by
Kuraszkiewicz et
al. (2003)
for ISO SEDs of X-ray selected AGN. However, we
cannot exclude the possibility that the effect in
Figure 6b is due to a higher
contamination by nuclear star formation in lower luminosity sources.
(shaded histogram) and
LIR > 3 × 10¹²
L
(open histogram).
Apparently, higher luminosity sources have, on average, a smaller
fraction of their emission in the IR.
Haas et al. (2003)
concluded that most of the observed emission is due to the AGN. The same
conclusion was reached by
Kuraszkiewicz et
al. (2003)
for ISO SEDs of X-ray selected AGN. However, we
cannot exclude the possibility that the effect in
Figure 6b is due to a higher
contamination by nuclear star formation in lower luminosity sources.