


3.1. Deuterium
The post-BBN evolution of D is straightforward. As gas is incorporated into stars the very loosely bound deuteron is burned to 3He (and beyond). Any D that passes through a star is destroyed. Furthermore, there are no astrophysical sites where D can be produced in an abundance anywhere near that observed (Epstein, Lattimer, & Schramm 1976). As a result, as the Universe evolves and gas is cycled through generations of stars, deuterium is only destroyed. Therefore, observations of the deuterium abundance anywhere, anytime, provide lower bounds on its primordial abundance. Furthermore, if D can be observed in "young" systems, in the sense of very little stellar processing, the observed abundance should be very close to the primordial value. Thus, while there are extensive data on deuterium in the solar system and the local interstellar medium of the Galaxy, it is the handful of observations of deuterium absorption in high-redshift, low-metallicity QSO absorption-line systems (QSOALS), which are potentially the most valuable. At sufficiently high redshifts and low metallicities, the primordial abundance of deuterium should reveal itself as a "deuterium plateau."
Inferring the primordial D abundance from the QSOALS has not been without its difficulties, with some abundance claims having been withdrawn or revised. Presently there are ~ half a dozen QSOALS with reasonably firm deuterium detections (Burles & Tytler 1998a, b; D'Odorico, Dessauges-Zavadsky, & Molaro 2001; O'Meara et al. 2001; Pettini & Bowen 2001; Kirkman et al. 2003). However, there is significant dispersion among the derived abundances, and the data fail to reveal the anticipated deuterium plateau (Fig. 4 - 6; see also Steigman 2003). Furthermore, subsequent observations of the D'Odorico et al. (2001) QSOALS by Levshakov et al. (2002) revealed a more complex velocity structure and led to a revised - and uncertain - deuterium abundance. This sensitivity to poorly constrained velocity structure in the absorbers is also exposed in the analyses of published QSOALS data by Levshakov and collaborators (Levshakov, Kegel, & Takahara 1998a, b, 1999), which lead to consistent, but somewhat higher, deuterium abundances than those inferred from "standard" data reduction analyses.
Indeed, the absorption spectra of DI and
HI are identical, except for
a wavelength/velocity offset resulting from the heavier reduced mass of
the deuterium atom. An HI "interloper", a low-column
density cloud shifted by ~ 81 km s-1 with respect to the main
absorbing cloud, would masquerade as DI. If this is not
accounted for, a D/H ratio which is too
high would be inferred. Since there are more low-column density absorbers
than those with high HI column densities, absorption-line
systems with somewhat lower HI column density (e.g.,
Lyman-limit systems) are more
susceptible to this contamination than are the higher HI
column density absorbers (e.g., damped
Ly absorbers). However,
for the damped
Ly absorbers,
an accurate determination of the HI column density
requires an accurate placement of the continuum, which could be
compromised by interlopers. This might lead to an overestimate of the
HI column density and a
concomitant underestimate of D/H (J. Linsky, private communication).
As will be seen, there is the possibility that each of these effects may
have contaminated the current data. Indeed, complex velocity structure
in the
D'Odorico et al. (2001)
absorber (see
Levshakov et al. 2002)
renders it of less value in constraining primordial deuterium, and it
will not be included in the estimates presented here.
absorbers). However,
for the damped
Ly absorbers,
an accurate determination of the HI column density
requires an accurate placement of the continuum, which could be
compromised by interlopers. This might lead to an overestimate of the
HI column density and a
concomitant underestimate of D/H (J. Linsky, private communication).
As will be seen, there is the possibility that each of these effects may
have contaminated the current data. Indeed, complex velocity structure
in the
D'Odorico et al. (2001)
absorber (see
Levshakov et al. 2002)
renders it of less value in constraining primordial deuterium, and it
will not be included in the estimates presented here.
In Figure 4 are shown the extant data (circa June 2003) for D/H as a function of metallicity from the work of Burles & Tytler (1998a, b), O'Meara et al. (2001), Pettini & Bowen (2002), and Kirkman et al. (2003). Also shown for comparison are the local interstellar medium (ISM) D/H (Linsky & Wood 2000) and that for the presolar nebula as inferred from solar system data (Geiss & Gloeckler 1998).
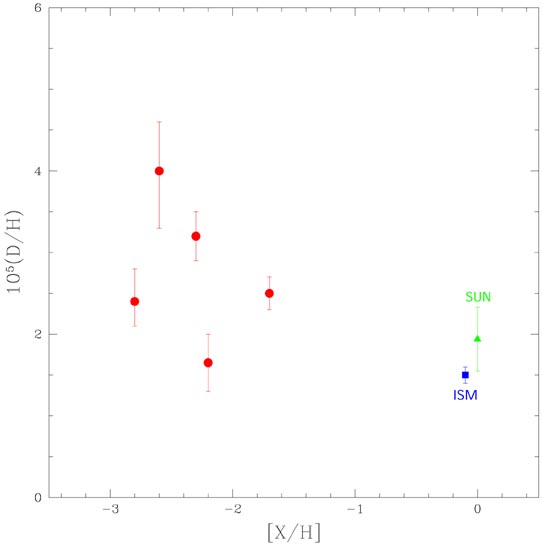 |
Figure 4. The deuterium abundance, D/H, versus metallicity, "X" (usually, X = Si), from observations (as of early 2003) of QSOALS (filled circles). Also shown for comparison are the D abundances for the local ISM (filled square) and the solar system ("Sun"; filled triangle). |
On the basis of our discussion of the post-BBN evolution of D/H,
a "deuterium plateau" at low metallicity was expected. If, indeed,
one is present, it is hidden by the dispersion in the current data.
Given the possibility that interlopers may affect both the
DI and the HI column density
determinations, it is interesting to plot D/H as a function of
N(HI). This is shown in
Figure 5,
where there is some (limited) evidence that D/H is higher in the
Lyman-limit systems than in the damped
Ly absorbers.
 |
Figure 5. The deuterium abundance, D/H, versus the HI column density in the absorbers, N(HI), for the same QSOALS as in Figure 4. |
To decide how to utilize this confusing data it may be of value to
consider the observations chronologically. Of the set chosen here,
Burles & Tytler
(1998a,
b)
studied the first two lines of sight. For PKS 1937-1009 they derived
yD  105(D/H) = 3.25 ± 0.3
(Burles & Tytler
1998a),
while for Q1009+299 they found yD =
3.98+0.59-0.67
(Burles & Tytler
1998b).
These two determinations are in excellent agreement with each other
(
105(D/H) = 3.25 ± 0.3
(Burles & Tytler
1998a),
while for Q1009+299 they found yD =
3.98+0.59-0.67
(Burles & Tytler
1998b).
These two determinations are in excellent agreement with each other
( 2 = 1.0), leading
to a mean abundance <yD> = 3.37 ± 0.27. Next,
O'Meara et al. (2001)
added the line of sight to HS 0105+1619, finding a considerably lower
abundance yD = 2.54 ± 0.23. Indeed, while the
weighted mean for these three lines of sight is
<yD> = 2.88, the
2 has ballooned
to 6.4 (for two degrees of freedom).
Absent any evidence that one or more of these abundances is in error,
O'Meara et al. adopt the mean, and, for the error in the mean, they take
the dispersion about the mean (0.72) divided by the square root of the
number of data points:
<yD> = 2.88 ± 0.42. One year later
Pettini & Bowen
(2001)
published their HST data on the line of sight
toward Q2206-199, finding a surprisingly low value of
yD = 1.65 ± 0.35.
Including this determination reduces the mean to
<yD> = 2.63, but the dispersion in
yD grows to 1.00 and
2 = 16.3 for
three degrees of freedom. Clearly, either one or more of these
determinations
is in error, or the variation among the high-redshift, low-metallicity
deuterium abundances is larger than anticipated from our understanding
of its evolution
(Jedamzik & Fuller
1997).
Using the mean and its
dispersion (to fix the error), as of the time of the Carnegie Symposium,
the best estimate for the primordial D abundance was
<yD> = 2.63 ± 0.50. Shortly thereafter, in
early 2003, the data of
Kirkman et al. (2003)
appeared for the line of sight toward Q1243+3047. For
this line of sight they find
yD = 2.42+0.35-0.25. This
abundance lies between the lowest and the higher previous values,
reducing the overall dispersion to 0.88, while hardly changing the mean
from yD = 2.63 to 2.60. While the total
2 is still
enormous, increasing slightly to 16.6, the reduced
2 decreases from 5.4
to 4.2. This is still far too large, suggesting that one or more of
these determinations may be contaminated, or that there may actually be
real variations in D/H at high redshifts and low metallicities. Notice
(see Fig. 5) that the largest D/H estimates are
from the two absorbers with the lowest HI column
densities (Lyman-limit systems),
where interlopers might contribute to the inferred
DI column densities, while the lowest abundances are from
the higher HI column density
(damped Ly ) absorbers,
where interlopers might affect the wings of the HI
lines used to fix the HI column
densities. Absent any further data supporting, or refuting, these
possibilities, there is no a priori reason to reject any of these
determinations.
2 = 1.0), leading
to a mean abundance <yD> = 3.37 ± 0.27. Next,
O'Meara et al. (2001)
added the line of sight to HS 0105+1619, finding a considerably lower
abundance yD = 2.54 ± 0.23. Indeed, while the
weighted mean for these three lines of sight is
<yD> = 2.88, the
2 has ballooned
to 6.4 (for two degrees of freedom).
Absent any evidence that one or more of these abundances is in error,
O'Meara et al. adopt the mean, and, for the error in the mean, they take
the dispersion about the mean (0.72) divided by the square root of the
number of data points:
<yD> = 2.88 ± 0.42. One year later
Pettini & Bowen
(2001)
published their HST data on the line of sight
toward Q2206-199, finding a surprisingly low value of
yD = 1.65 ± 0.35.
Including this determination reduces the mean to
<yD> = 2.63, but the dispersion in
yD grows to 1.00 and
2 = 16.3 for
three degrees of freedom. Clearly, either one or more of these
determinations
is in error, or the variation among the high-redshift, low-metallicity
deuterium abundances is larger than anticipated from our understanding
of its evolution
(Jedamzik & Fuller
1997).
Using the mean and its
dispersion (to fix the error), as of the time of the Carnegie Symposium,
the best estimate for the primordial D abundance was
<yD> = 2.63 ± 0.50. Shortly thereafter, in
early 2003, the data of
Kirkman et al. (2003)
appeared for the line of sight toward Q1243+3047. For
this line of sight they find
yD = 2.42+0.35-0.25. This
abundance lies between the lowest and the higher previous values,
reducing the overall dispersion to 0.88, while hardly changing the mean
from yD = 2.63 to 2.60. While the total
2 is still
enormous, increasing slightly to 16.6, the reduced
2 decreases from 5.4
to 4.2. This is still far too large, suggesting that one or more of
these determinations may be contaminated, or that there may actually be
real variations in D/H at high redshifts and low metallicities. Notice
(see Fig. 5) that the largest D/H estimates are
from the two absorbers with the lowest HI column
densities (Lyman-limit systems),
where interlopers might contribute to the inferred
DI column densities, while the lowest abundances are from
the higher HI column density
(damped Ly ) absorbers,
where interlopers might affect the wings of the HI
lines used to fix the HI column
densities. Absent any further data supporting, or refuting, these
possibilities, there is no a priori reason to reject any of these
determinations.
To utilize the current data, the weighted mean D abundances for these
five lines of sight and the dispersion are used to infer the abundance
of primordial deuterium (and its uncertainty) adopted in this review:
yD = 2.6 ± 0.4. Note that, given the large
dispersion, two-decimal
place accuracy seems to be wishful thinking at present. For this reason,
in quoting the primordial D abundance inferred from the observational
data I have purposely chosen to quote values to only one decimal place.
This choice is consistent too with the ~ 3% - 8% theoretical uncertainty
(at fixed  ) in
the BBN-predicted abundance. In Figure 6
are shown the data, along with the corresponding
1
) in
the BBN-predicted abundance. In Figure 6
are shown the data, along with the corresponding
1 band. It is
worth remarking that using the same data
Kirkman et al. (2003)
derive a slightly higher mean D abundance: yD =
2.74. The reason for the difference is that they first find the mean of
log(yD) and then use it to compute the mean D abundance
(yD
10<log(yD)>).
band. It is
worth remarking that using the same data
Kirkman et al. (2003)
derive a slightly higher mean D abundance: yD =
2.74. The reason for the difference is that they first find the mean of
log(yD) and then use it to compute the mean D abundance
(yD
10<log(yD)>).
 |
Figure 6. As in
Figure 4. The dashed lines represent the
± 1 |