


4.3. Cataclysmic variables
Cataclysmic variables are best identified when an optical counterpart
is found. A good indicator is that the optical counterpart is bluer
than the main sequence, especially in the ultraviolet; and/or that it
has strong H emission
(see Figure 11). As an
example, such counterparts were identified in NGC6397, and followup
spectra show the strong Balmer emission lines prevalent in cataclysmic
variables
(Cool et al. 1995,
Grindlay et al. 1995,
Edmonds et al. 1999;
note that firm identifications were only possible once Chandra
had obtained accurate positions,
Grindlay et
al. 2001b).
Quiescent neutron-star low-mass X-ray binaries also have blue spectra with
Balmer emission, but can be distinguished from cataclysmic variables
through their soft X-ray spectra, and by the fact that they are more
luminuos than cataclysmic variables (see
section 4.1).
Optical and ultraviolet color-magnitude diagrams have been used to
classify optical counterparts as cataclysmic variables also in
NGC6752 and in 47Tuc
(Pooley et al. 2002a,
Edmonds et al. 2003).
emission
(see Figure 11). As an
example, such counterparts were identified in NGC6397, and followup
spectra show the strong Balmer emission lines prevalent in cataclysmic
variables
(Cool et al. 1995,
Grindlay et al. 1995,
Edmonds et al. 1999;
note that firm identifications were only possible once Chandra
had obtained accurate positions,
Grindlay et
al. 2001b).
Quiescent neutron-star low-mass X-ray binaries also have blue spectra with
Balmer emission, but can be distinguished from cataclysmic variables
through their soft X-ray spectra, and by the fact that they are more
luminuos than cataclysmic variables (see
section 4.1).
Optical and ultraviolet color-magnitude diagrams have been used to
classify optical counterparts as cataclysmic variables also in
NGC6752 and in 47Tuc
(Pooley et al. 2002a,
Edmonds et al. 2003).
 |
 |
Figure 11. U-V and
H |
If no optical colors are available, the ratio of X-ray to optical flux provides a good, but not conclusive, indication whether a source is a cataclysmic variable, as documented with cataclysmic variables studied in the ROSAT All Sky Survey (Verbunt et al. 1997, Verbunt & Johnston 2000). In Figure 12 we show (a measure of) the X-ray luminosity in the 0.5-4.5keV range as a function of the absolute visual magnitude for X-ray sources in 47Tuc and in NGC6752. Only sources which have been classified on the basis of optical/ultraviolet color magnitude diagrams are shown. In this Figure we further plot the line
 |
(2) |
where CTR0.5-4.5 keV is the number of counts per second
in the 0.5-4.5 keV range, and dkpc the distance in kpc.
This line roughly separates the cataclysmic variables from magnetically
active binaries. A parallel line for an X-ray luminosity which
is a factor  40 higher
roughly separates the cataclysmic
variables from the low-luminosity low-mass X-ray binaries with a neutron
star. The figure shows that the ratio of X-ray to optical luminosity is
a fairly good classifier of X-ray sources in the absence of more
conclusive information.
40 higher
roughly separates the cataclysmic
variables from the low-luminosity low-mass X-ray binaries with a neutron
star. The figure shows that the ratio of X-ray to optical luminosity is
a fairly good classifier of X-ray sources in the absence of more
conclusive information.
A further indicator that a source is a cataclysmic variable may be
found from optical variability, either orbital or from a (dwarf) nova
outburst. Orbital variability may be present in magnetically active
binaries too, and thus can be used to classify a source only in
combination with other information, such as color magnitude diagrams,
or ratio of X-ray to visual flux. Two cataclysmic variables were found
in NGC6752 based on periodic variability and
H emission
by Bailyn et
al. (1996),
and were identified with Chandra X-ray sources
by Pooley et
al. (2002a).
Variability indicative of
dwarf nova outbursts has been detected for several blue objects
in 47Tuc (e.g.
Paresce et al. 1992,
Paresce & De Marchi
1994,
Shara et al. 1996);
these sources have subsequently been
identified with Chandra X-ray sources
(Grindlay et
al. 2001a).
An optical variable in the core of NGC6656/M22 has been identified as
a possible dwarf nova, detected in X-rays with Einstein, ROSAT and XMM
(Anderson et al. 2003;
see Table 2).
So far, only 47Tuc, NGC6397 and NGC6752 have been studied
to such an extent that a large fraction of the X-ray sources in
them has been optically identified. Most of them are classified as
cataclysmic variables. In
 Cen, several Chandra sources
have been identified with (optically detected) cataclysmic variables
(Carson et al. 2000),
but HST observations only cover a small fraction of the cluster.
Classifications based only on the X-ray to optical flux ratio must
be considered preliminary, as illustrated by the case of NGC6752 CX11
(see sect. 4.2).
Cen, several Chandra sources
have been identified with (optically detected) cataclysmic variables
(Carson et al. 2000),
but HST observations only cover a small fraction of the cluster.
Classifications based only on the X-ray to optical flux ratio must
be considered preliminary, as illustrated by the case of NGC6752 CX11
(see sect. 4.2).
In general it may be stated that the properties of cataclysmic variables in globular clusters are similar to those of cataclysmic variables in the Galactic disk (i.e. in the solar neighborhood). In the Galactic disk distances and interstellar absorption for cataclysmic variables are only inaccurately determined at best. In contrast, for systems in globular clusters these quantities may be set equal to the values for the cluster, which are much better known. Thus comparison between different classes of objects will be more accurate in globular clusters.
As an example, we note that Verbunt & Hasinger (1998) in their analysis of ROSAT observations of 47Tuc use the ratio of X-ray to visual flux to suggest that 47Tuc X9, identified with the blue variable V1, is a low-luminosity low-mass X-ray binary with a neutron star. In Figure 12, based on more accurate Chandra data and now secure identifications, the systems with the three highest X-ray to optical flux ratios in 47 Tuc are X10/V3, X7 and X9/V1. X7 is indeed a low-luminosity low-mass X-ray binary with a neutron star, but the hard X-ray spectra of X10 and X9 indicate that they are probably cataclysmic variables. This illustrates the overlap between low-mass X-ray binaries and cataclysmic variables in the X-ray to visual flux ratio.
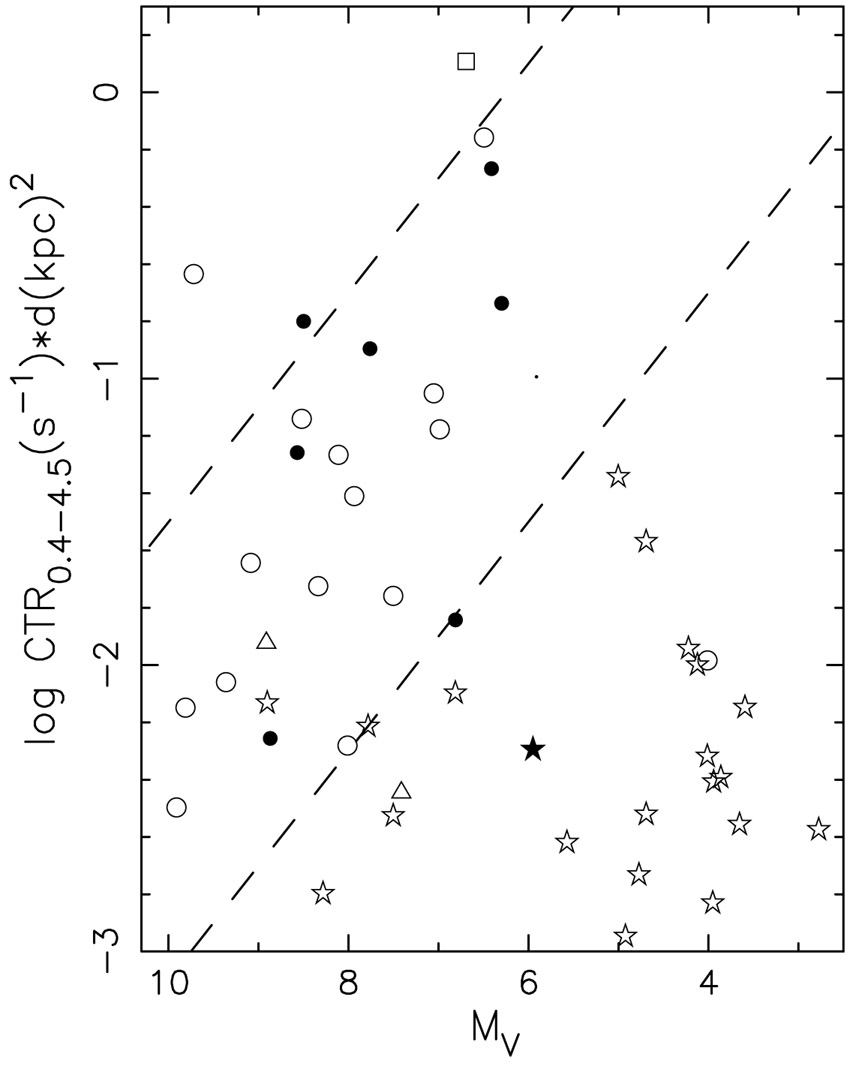 |
Figure 12. X-ray luminosity as a function of absolute visual magnitude, for optically identified Chandra sources in 47Tuc (open symbols) and NGC6752 (filled symbols). Squares, circles, triangles and stars indicate low-luminosity LMXBNS, cataclysmic variables, (companions to) recycled pulsars, and magnetically active binaries, respectively. To minimize model dependence, the X-ray luminosity is expressed as the product of Chandra countrate CTR (in the 0.5-4.5 keV band, corrected for interstellar absorption) and the cluster distance d (in kpc) squared. Two dashed lines of constant ratio of X-ray to visual flux roughly separate the low-luminosity low-mass X-ray binaries with neutron stars from the cataclysmic variables; and the latter from the magnetically active binaries (see Verbunt & Hasinger 1998, Pooley et al. 2002a). Data from Edmonds et al. (2003), Pooley et al. (2002a). |