


Alves et al. (2002) presented and analyzed the first near-infrared data for LMC red clump giants. The K-band data were obtained with the SOFI infrared imager at the New Technology Telescope. Additional V and I data were obtained with WFPC2 onboard the HST. A comparison of multiwavelength luminosity functions of the LMC red clump with those of the Hipparcos red clump yielded simultaneously the mean interstellar reddening correction and true LMC distance modulus: µ0 = 18.493 ± 0.033r ± 0.03s (random and systematic error, respectively). Pietrzynski & Gieren (2002) also used K-band red clump data to derive µ0 = 18.471 ± 0.008r ± 0.045s, as did Sarajedini et al. (2002) who obtained µ0 = 18.54 ± 0.10. The reddening correction accounts for the 0.02 mag discrepancy between the results of Alves et al. (2002) and Pietrzynski & Gieren (2002). Sarajedini et al. (2002) include the systematic errors associated with the red clump population correction and the geometric tilt of the LMC in their reported error bar. Despite these minor differences, the Hipparcos-calibrated red clump distance to the LMC has probably converged. It is encouraging that 3 independent estimates of the apparent K magnitude of the LMC red clump all agree to within an accuracy of 1-2%.
Figure 1 shows the tip of the red giant branch (TRGB) in the LMC. These are unpublished HST/WFPC2 color-magnitude data for 17 different fields on lines-of-sight to LMC microlensing events. I have applied the average reddening correction derived from multiband red clump data for 6 of the fields (Alves et al. 2002). The TRGB calibration from Bellazini et al. (2001) is shown assuming µ0 = 18.5 mag. The weak metallicity dependence of the calibration is expressed in terms of color. Note that the colors of the LMC TRGB stars suggest a range of metallicities from [Fe/H] = -2 to -1 dex with a mode of about -1.4 dex. This comparison shows that the TRGB and red clump methods yield superb agreement with the standard LMC distance modulus.
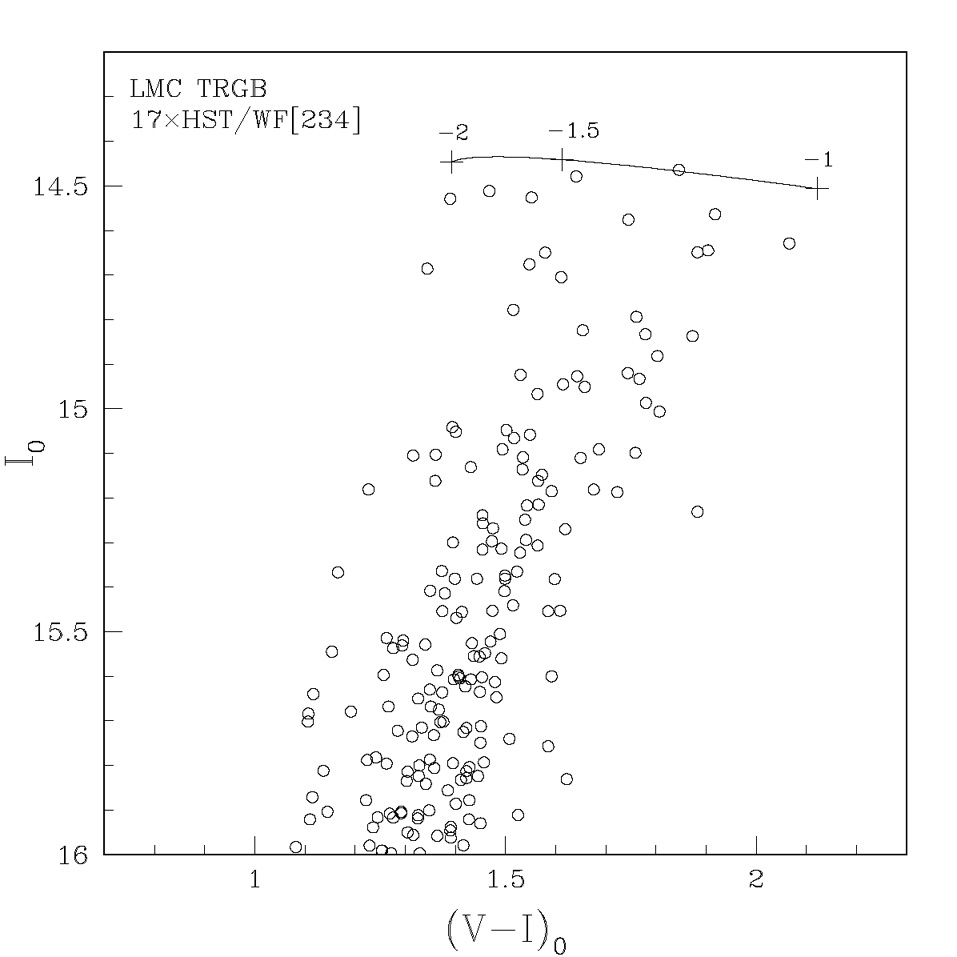 |
Figure 1. Color-magnitude array of HST/WFPC2 data where LMC TRGB stars (circles) are compared with the Galactic TRGB calibration (line) assuming µ0 = 18.5 mag. The tick marks along the TRGB calibration label [Fe/H]. |