


In the review just presented, the corrections employed by different authors to account for the inclination of the LMC in the plane of the sky were not always self-consistent. There is no standard model for LMC structure, at least not yet. Moreover, it is not known that the Population II distance indicators like RR Lyrae variables are distributed in the same way as the young and intermediate-age stellar populations which represent the bulk of the LMC disk, and hence whether or not a correction appropriate for the disk should apply. The eclipsing binaries studied in the LMC so far have been mostly Population I stars.
In a series of recent papers (e.g.,
van der Marel & Cioni
2001,
van der Marel et al. 2002),
a new understanding of the structure of the LMC has emerged.
It is now known that the photometric major axis is not
the same as the line-of-nodes. The LMC is intrinsically elongated.
The line-of-nodes derived from a variety of different distance indicators
that uniformly cover the entire face of the LMC
is  = 122.°5
± 8.°3 measured East of North
(van der Marel & Cioni
2001),
while the radial velocity field of carbon stars implies
= 129.°6
± 6.°0 in good agreement
(van der Marel et
al. 2002).
The photometric major axis is about 50° away. The inclination is
34.°7 ± 6.°2.
Several independent estimates for the center of the LMC
are consistent with the optical center. The notable exception is
the center derived from the velocity field of the HI gas, which is
disturbed and probably not useful for making inferences about
the LMC's structure
(van der Marel et
al. 2002).
= 122.°5
± 8.°3 measured East of North
(van der Marel & Cioni
2001),
while the radial velocity field of carbon stars implies
= 129.°6
± 6.°0 in good agreement
(van der Marel et
al. 2002).
The photometric major axis is about 50° away. The inclination is
34.°7 ± 6.°2.
Several independent estimates for the center of the LMC
are consistent with the optical center. The notable exception is
the center derived from the velocity field of the HI gas, which is
disturbed and probably not useful for making inferences about
the LMC's structure
(van der Marel et
al. 2002).
The LMC disk is thick
(van der Marel et
al. 2002).
The ratio of rotational to pressure support is
V /  ~ 2.9 ±
0.9, where for comparison the Galactic thin and thick disks have
ratios of 9.8 and 3.9, respectively.
The ratio of vertical to radial disk scale heights is about 1/3
for both the LMC disk and the Galactic thick disk.
The LMC disk is also flared
(Alves & Nelson 2000).
The vertical exponential scale height of carbon stars attains
a value of about 1 kpc at locations 5-6 degrees from center,
and is about 100 pc near the center
(van der Marel et
al. 2002).
These inferences about the LMC disk are
based on stellar kinematics and simple equilibrium models.
High precision distance indicators like Cepheids
have not yet resolved the thickness of the LMC disk.
However, observations of the light echoes from Supernova 1987A
are consistent with a thickness of about 1 kpc (A. Crotts,
priv. comm.).
~ 2.9 ±
0.9, where for comparison the Galactic thin and thick disks have
ratios of 9.8 and 3.9, respectively.
The ratio of vertical to radial disk scale heights is about 1/3
for both the LMC disk and the Galactic thick disk.
The LMC disk is also flared
(Alves & Nelson 2000).
The vertical exponential scale height of carbon stars attains
a value of about 1 kpc at locations 5-6 degrees from center,
and is about 100 pc near the center
(van der Marel et
al. 2002).
These inferences about the LMC disk are
based on stellar kinematics and simple equilibrium models.
High precision distance indicators like Cepheids
have not yet resolved the thickness of the LMC disk.
However, observations of the light echoes from Supernova 1987A
are consistent with a thickness of about 1 kpc (A. Crotts,
priv. comm.).
Minniti et al. (2003)
recently obtained kinematic data for the metal-poor
stellar population in the LMC using the
European Southern Obervatory's Very Large Telescope.
The radial velocities derived from the spectra of 43 RR Lyrae stars
imply a line-of-sight
= 53 ± 10 km
s-1,
which is larger than that of any other population in the LMC.
For comparison, the carbon stars analyzed by
van der Marel et al. (2002)
have = 20.2 ± 0.5
km s-1.
Minniti et al. (2003)
interpret the RR Lyrae velocity data as evidence for a stellar halo.
Therefore, the LMC is the nearest example of a
disk galaxy that has a halo, but not a bulge, and in this
way it is similar to M33
(Gebhardt et al. 2001).
Finally, 3 warps in the LMC disk have recently been detected using a reddening-free color-magnitude index I0 = I - 1.4 .(V - I) + 1.29 in conjunction with V & I data for the red clump (Olsen & Salyk 2002; Subramaniam 2003). The Olsen & Salyk (2002) warp in the South-West quadrant of the disk, and the more significant of the two warps found by Subramaniam (2003), specifically the warp at the East end of the bar, are both coincident with regions of higher reddening. Olsen & Salyk (2002) suggested that a foreground dust cloud was responsible in the South-West, but this does not explain a second coincidentally reddened warp at the East end of the bar. No other distance indicator has yet confirmed the existence of these warps.
The star formation histories (SFHs) of the LMC fields with warps have not yet been derived. Therefore, it is possible that the warps are caused by a change in the mix of young and old red clump stars. Compare the two simulated color-magnitude diagrams of the LMC red clump shown in Figure 2 (M. Salaris, priv. comm.). The left panel corresponds to the fiducial SFH adopted by Salaris et al. (2003b), which is constrained by observations of mostly main sequence stars. The right panel shows an illustrative example of a redder red clump associated with a fictitious SFH that would be difficult to detect except for the color of its clump. A higher fraction of the stars on the right mixed in with the stars on the left in certain regions of the LMC could be misinterpreted as physical warps that are coincidentally also in regions of high reddening.
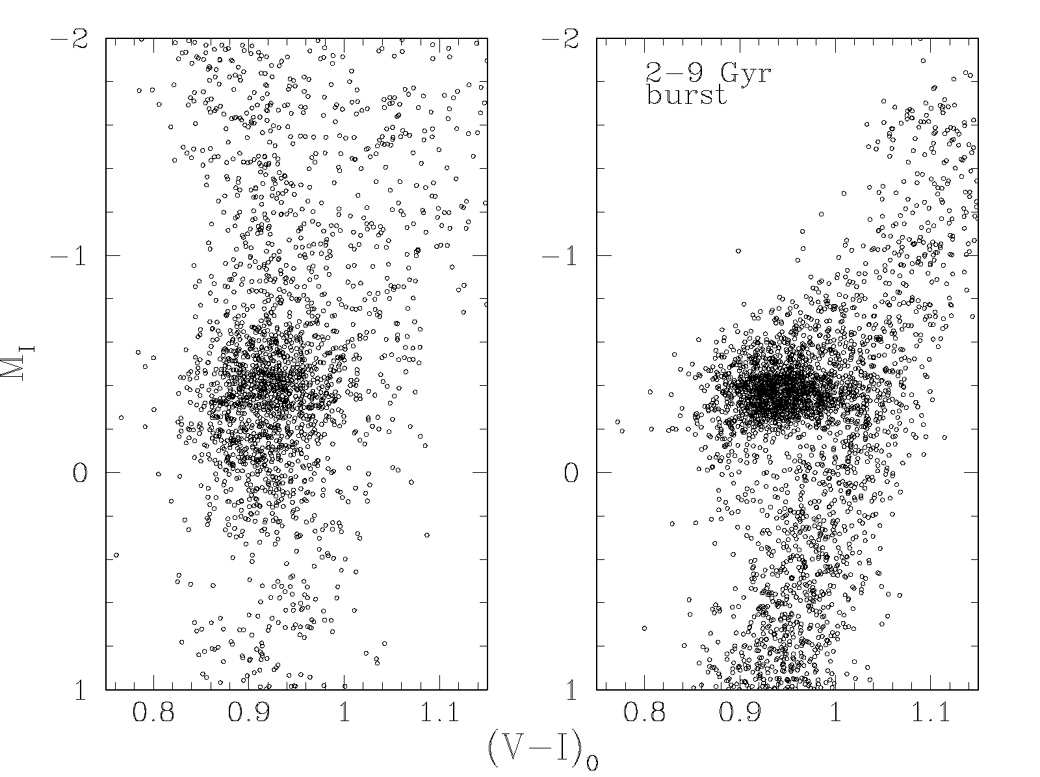 |
Figure 2. (Left) Simulated color-magnitude diagram for the LMC red clump based on fiducial star formation history adopted by Salaris et al. (2003b). (Right) Another simulated color-magnitude diagram, but for a fictitious burst of field star formation between 2 and 9 Gyrs ago that produces a redder red clump. |
The LMC has both young and old populations with distinct properties, although the detailed nature of the latter is not yet well known. Therefore, it is possible that old clump stars could be mixed with young clump stars in unexpected ways to create complex color-magnitude variations across the LMC. New K-band data would help to test this hypothesis (Alves et al. 2002).