


5.1. Source Counts and Cosmic IR Background
The source counts at 15 µm exhibit a strong excess of faint sources below S15 ~ 2 mJy. This excess is usually defined by comparison with model predictions assuming that galaxies behaved similarly in the distant universe as they do today. Such "no evolution" behavior is represented by a shaded area in the Fig. 5 (see figure caption). Galaxies above this flux density do fall within this region, as illustrated by the data points from the ELAIS-S1 field (Gruppioni et al. 2003, see also Oliver et al. in this book). In Fig. 5, we have separated the data points from the IGTES (Elbaz et al. 1999) between those below and above S15 = 1 mJy, with filled and open dots respectively. Data above this flux density from Elbaz et al. (1999) appear to be inconsistent with those derived from ELAIS-S1. Most of those points were derived from the Shallow Survey of the Lockman Hole within the IGTES, which suffered from having less redundant observations of a given sky pixel. At that time, ISOCAM data reduction methods were not optimized for such surveys, but since then, they have been improved to better deal with such shallow surveys. Among the techniques that are discussed below, the "Lari" technique is particularly suitable for such low redundancy surveys (and even more for the very shallow ELAIS surveys, see Oliver et al. in this book) and a recent analysis of the Lockman Hole Deep (Fadda et al. 2004, large open squares) and Shallow (Rodighiero et al. 2004, large open stars) surveys from the IGTES provided new number counts at these flux densities perfectly consistent with those derived from ELAIS-S1 by Gruppioni et al. (2003) also using the same "Lari" technique. Note that the models designed to fit the ISOCAM number counts were constrained by the Elbaz et al. (1999) results, hence overproduce the number of sources above S15 ~ 2 mJy. As a natural result, they have also overpredicted the number of sources detected in the high flux density regime at 24 µm with Spitzer (see Sect. 7 and Papovich et al. 2004, Chary et al. 2004).
Above the Earth's atmosphere, the 15 µm light is strongly dominated by the zodiacal emission from interplanetary dust and it has not yet been possible to make a direct measurement of the 15 µm background, or EBL. Individual galaxies contribute to this background and a lower limit to the 15 µm EBL can be obtained by adding up the fluxes of all ISOCAM galaxies detected per unit area down to a given flux limit. The resulting value is called the 15 µm integrated galaxy light (IGL).
As in Elbaz et al. (2002), the differential number counts can be converted into a differential contribution to the 15 µm IGL as a function of flux density, estimated from the following formula:
 |
(1) |
where dN(sr-1) is the surface density of sources with
a flux density
S [15 µm ]= S15 (mJy) over a
flux density bin dS(mJy) (1 mJy = 10-20 nW
m-2 Hz-1) and
15(Hz)
is the frequency of the 15 µm photons.
[15 µm ]= S15 (mJy) over a
flux density bin dS(mJy) (1 mJy = 10-20 nW
m-2 Hz-1) and
15(Hz)
is the frequency of the 15 µm photons.
About 600 galaxies below S15 ~ 3 mJy, were used to
provide the points with errors bars in Fig. 8a.
Fig. 8b
shows the 15 µm IGL as a function of depth. It corresponds
to the integral of Fig. 8a, where the data below
3 mJy were fitted with a polynomial of degree 3 and the
1- error bars on
dIGL / dS were obtained from the polynomial fit to the
upper and lower limits of the data points. The 15 µm IGL
does not converge above a sensitivity limit of
S15 ~ 50µJy, but the flattening of
the curve below
S15 ~ 0.4 mJy suggests that most of the
15 µm EBL should arise from the galaxies already unveiled by
ISOCAM. Above this flux density limit, where the completeness limit is
larger than 80% - including lensed objects-, it is equal to 2.4
± 0.5 nW m-2 sr-1
(Elbaz et al. 2002).
Down to a 50% completeness limit,
Metcalfe et al.
(2003)
found a 10% larger value
including sources down to 30µJy but the statistics remains
limited at these depths with only four sources below 50µJy.
error bars on
dIGL / dS were obtained from the polynomial fit to the
upper and lower limits of the data points. The 15 µm IGL
does not converge above a sensitivity limit of
S15 ~ 50µJy, but the flattening of
the curve below
S15 ~ 0.4 mJy suggests that most of the
15 µm EBL should arise from the galaxies already unveiled by
ISOCAM. Above this flux density limit, where the completeness limit is
larger than 80% - including lensed objects-, it is equal to 2.4
± 0.5 nW m-2 sr-1
(Elbaz et al. 2002).
Down to a 50% completeness limit,
Metcalfe et al.
(2003)
found a 10% larger value
including sources down to 30µJy but the statistics remains
limited at these depths with only four sources below 50µJy.
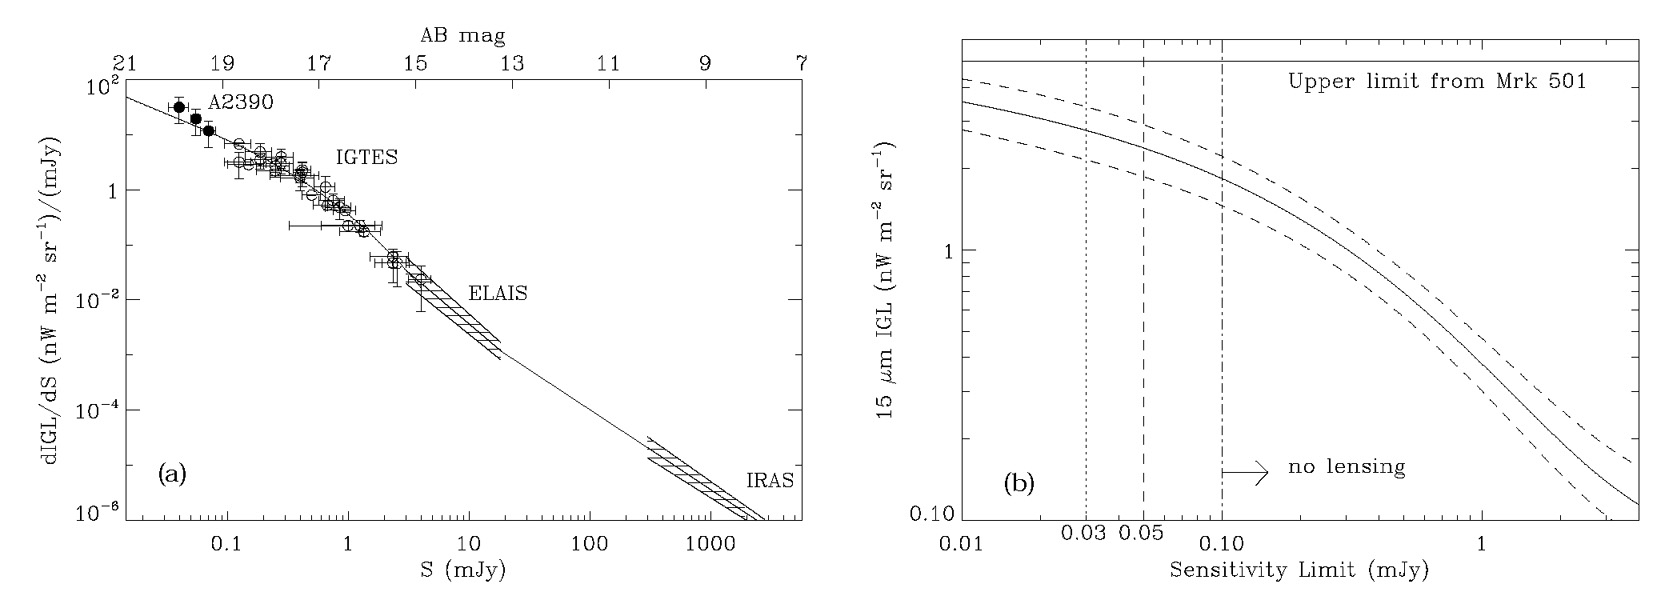 |
Figure 8. a) Differential
contribution to the 15 µm
Integrated Galaxy Light as a function of flux density and AB
magnitude. The plain line is a fit to the data: Abell 2390
(Altieri et al.
1999),
the ISOCAM Guaranteed Time Extragalactic Surveys (IGTES,
Elbaz et al. 1999),
the European Large Area Infrared Survey (ELAIS,
Serjeant et al.
2000)
and the IRAS all sky survey
(Rush, Malkan &
Spinoglio 1993).
b) Contribution of ISOCAM galaxies to the
15 µm extragalactic background light (EBL),
i.e. 15 µm Integrated Galaxy Light (IGL), as a function of
sensitivity or AB magnitude
(AB = -2.5 log(SmJy) + 16.4). The plain
line is the integral of the fit to
dIGL/dS (Fig.a). The dashed lines correspond to
1- |
Franceschini et al. (2001) and Chary & Elbaz (2001), developped models which reproduce the number counts from ISOCAM at 15 µm, from ISOPHOT at 90 and 170 µm and from SCUBA at 850 µm, as well as the shape of the CIRB from 100 to 1000 µm. These models consistently predict a 15 µm EBL of:
 |
(2) |
If this prediction from the models is correct then about 73 ± 15% of the 15 µm EBL is resolved into individual galaxies by the ISOCAM surveys.
This result is consistent with the upper limit on the 15 µm EBL estimated by Stanev & Franceschini (1998) of:
 |
(3) |
This upper limit was computed from the 1997
 -ray
outburst of the blazar Mkn 501 (z = 0.034) as a result of the
opacity of mid IR photons to
-ray
photons, which annihilate with them through
e+e- pair production. It was since
confirmed by
Renault et al. (2001),
who found an upper limit of 4.7 nW m-2 sr-1 from
5 to 15 µm.
-ray
outburst of the blazar Mkn 501 (z = 0.034) as a result of the
opacity of mid IR photons to
-ray
photons, which annihilate with them through
e+e- pair production. It was since
confirmed by
Renault et al. (2001),
who found an upper limit of 4.7 nW m-2 sr-1 from
5 to 15 µm.
Nearly all the IGL is produced by sources fainter than 3 mJy (94%) and about 70% by sources fainter than 0.5 mJy. This means that the nature and redshift distribution of the galaxies producing the bulk of the 15 µm IGL can be determined by studying these faint galaxies only.