


5.3. Nature of the ISOCAM Galaxies
The Hubble Deep Field North and its Flanking Fields (HDFN+FF) provides the best coverage in spectroscopic redshifts and deep optical images for an ISOCAM deep survey. We used the revised version of the Aussel et al. (1999) catalog for which 85% (71%) of the 40 (86) galaxies above 100µJy (30µJy) have a spectroscopic redshift to determine the average properties of ISOCAM galaxies summarized in the Figs. 11, 12. Their optical counterparts are relatively bright and their median-mean redshift is close to z ~ 0.8 (Fig. 11). Note the redshift peaks in which the ISOCAM galaxies are located, leaving wide empty spaces in between. Most ISOCAM galaxies are located within large-scale structures, here mainly those at z = 0.848 and z = 1.017, which might be galaxy clusters in formation where galaxy-galaxy interactions are amplified (Elbaz & Cesarsky 2003, see discussion below).
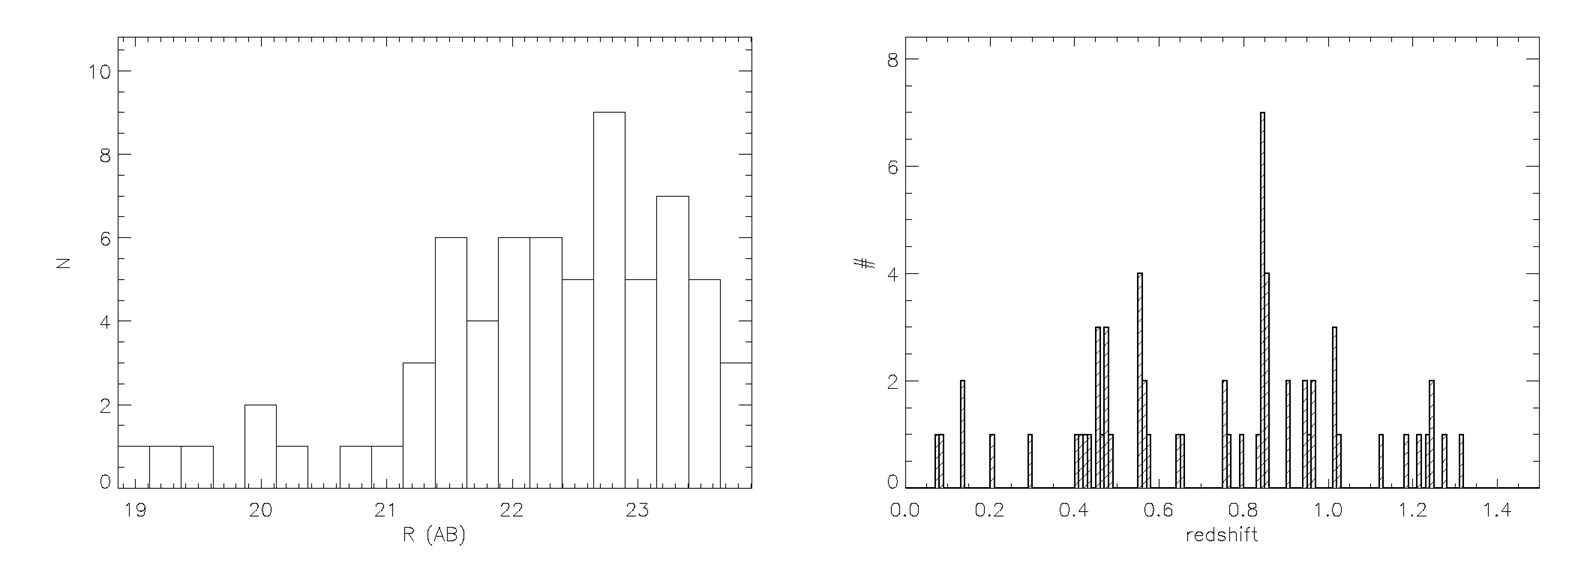 |
Figure 11. (left) Histogram of the R(AB) magnitudes of the 15 µm ISOCAM galaxies detected in the HDFN+FF (revised catalog of Aussel et al. down to ~ 30 µJy. (right) Redshift distribution of the HDFN+FF ISOCAM galaxies. |
Thanks to the deepest soft to hard X-ray survey ever performed with Chandra in the HDFN, it is possible to pinpoint active galactic nuclei (AGNs) in this field including those affected by dust extinction. Only five sources were classified as AGN dominated on the basis of their X-ray properties (Fadda et al. 2002). Hence, unless a large number of AGNs are so dust obscured that they were even missed with the 2 Megaseconds Chandra survey, the vast majority of ISOCAM galaxies are powered by star formation. This result is consistent with observations of local galaxies which indicate that only the upper luminosity range of ULIRGs are dominated by an AGN (Tran et al. 2001).
Using the mid-far IR correlations (Chary & Elbaz 2001, Elbaz et al. 2002, see also Sec. 5.2), the LIR distribution of the HDFN mid IR sources is plotted in Fig. 12a. Most of them belong to the LIRG and ULIRG regime, although when including flux densities below completeness down to 30µJy, one finds also intermediate luminosities. Finally, their stellar masses are among the largest in their redshift range, when compared to the stellar mass estimates by Dickinson et al. (2003) in the HDFN (Fig. 12b).
 |
Figure 12. (left) Distribution of the
log(LIR (8-1000 µm ) /
L |
In the local universe, both LIRGs and ULIRGs exhibit the typical morphology of major mergers, i.e. mergers of approximately equal mass (Sanders & Mirabel 1996, Sanders, Surace & Ishida 1999). In the case of LIRGs, the merging galaxies show a larger separation than for ULIRGs, which are mostly in the late phase of the merger. Fig. 13 (Elbaz & Moy 2004) presents the HST-ACS morphology of a sample of z ~ 0.7 LIRGs in the GOODSN field (extended HDFN). Less than half of these galaxies clone the morphology of local LIRGs, which implies that the physical processes switching on the star formation activity in distant LIRGs might be different than for local ones. The gas mass fraction of younger galaxies being larger, other types of interactions might generate a LIRG phase in the distant universe, such as minor mergers or even passing-by galaxies producing a tidal effect. The fact that such interactions are more frequent than major mergers could also explain the importance of the LIRG phase for galaxies in general and also the possibility for a galaxy to experience several intense bursts in its lifetime. The appearance of this phase of violent star formation could be facilitated during the formation of groups or clusters of galaxies.
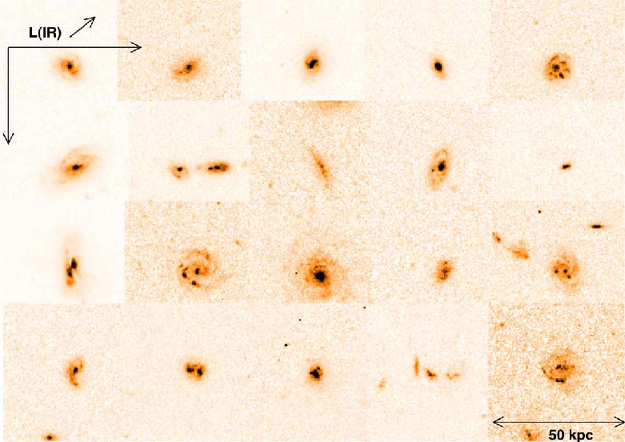 |
Figure 13. HST-ACS images of LIR galaxies
with 11
|
A striking example of this is given by the large fraction of LIRGs
detected in the distant galaxy cluster J1888.16CL, located at a redshit of z = 0.56
(Duc et al. 2004).
Among the 27 objects for which
spectra were obtained, six of them belong to the cluster while an
extra pair with slightly higher redshifts may lie in infalling groups.
All eight galaxies exhibit weak emission lines in their optical
spectra, typical of dust enshrouded star forming galaxies, none of
these lines being broad enough to indicate the presence of type I
AGNs. In this relatively young galaxy cluster, the mechanism that may
be triggering SFRs between 20 and 120
M yr-1 for at least
eight objects of the cluster could well be tidal collisions within
sub-structures or infalling groups. On a more local scale, the mid IR
emission of the Abell 1689 (z = 0.181) galaxies exhibits an
excess of the B-[15] color with respect to richer and closer galaxy
clusters, such as Coma and Virgo, which suggests the presence of a mid IR
equivalent to the Butcher-Oemler effect, i.e. the star formation
activity of galaxies as reflected by their mid IR emission increases
with increasing redshift
(Fadda et al. 2000).
The high fraction of blue
galaxies intially reported for this cluster by
Butcher & Oemler (1984)
was later on confirmed by
Duc et al. (2002),
who also found that
the actual SFR for these galaxies was on average ten times larger than
the one derived from the [OII] emission line implying that 90% of
the star formation activity taking place in this cluster was hidden by
dust.
yr-1 for at least
eight objects of the cluster could well be tidal collisions within
sub-structures or infalling groups. On a more local scale, the mid IR
emission of the Abell 1689 (z = 0.181) galaxies exhibits an
excess of the B-[15] color with respect to richer and closer galaxy
clusters, such as Coma and Virgo, which suggests the presence of a mid IR
equivalent to the Butcher-Oemler effect, i.e. the star formation
activity of galaxies as reflected by their mid IR emission increases
with increasing redshift
(Fadda et al. 2000).
The high fraction of blue
galaxies intially reported for this cluster by
Butcher & Oemler (1984)
was later on confirmed by
Duc et al. (2002),
who also found that
the actual SFR for these galaxies was on average ten times larger than
the one derived from the [OII] emission line implying that 90% of
the star formation activity taking place in this cluster was hidden by
dust.
LIRGs could then be a tracer of large-scale structures in formation as
suggested by their redshift distribution
(Fig. 11b, see also
Elbaz & Cesarsky 2003).
In order to test this hypothesis, Moy &
Elbaz (in prep.) compared the fraction of ISOCAM galaxies (above the
completeness limit of 0.1 mJy) found in "redshift peaks" to the one
obtained when randomly selecting field sources of equal optical and
K-band magnitudes in the same redshift range. Redshift peaks of
different strengths, measured as
N- , were defined by
smoothing the field galaxies redshift distribution by 15,000 km/s
(Fig. 14a) and measuring the peaks
N- above the
smoothed distribution. The Monte-Carlo samples of field galaxies to
be compared to the redshift distribution of the ISOCAM galaxies were
selected within the real redshift distribution and not the smoothed
one. The distribution of the Monte-Carlo simulations are shown with
error bars at the 68 and 90% level. When considering the whole
ISOCAM catalog, i.e. including faint sources below completeness, it
appears that ISOCAM galaxies are more clustered than field galaxies.
Less than 32% of the simulations present a comparable clustering
than the whole ISOCAM sample which contains a large fraction of non
LIRGs. Strickingly, when only selecting the brightest galaxies above
the completeness limit of 0.1 mJy, one finds that they are LIRGs and
ULIRGs which fall in the densest redshift peaks, above
6-. The
probability to randomly select a sample of galaxies from the field
(with equal magnitudes and redshift range) in the redshift peaks of
6- and above is less
than 1%. As a result, mid IR surveys
are very efficient in selecting over-dense regions in the universe,
which in return are very efficient in producing a LIRG. On the
contrary, mid IR selected galaxies are locally less clustered than
field galaxies
(Gonzalez-Solares et
al. 2004),
which could be a natural
result of the fact that only the less clustered galaxies still produce
IR luminous phases while more clustered galaxies lived their IR
luminous phase in the past (see also
Elbaz & Cesarsky 2003).
, were defined by
smoothing the field galaxies redshift distribution by 15,000 km/s
(Fig. 14a) and measuring the peaks
N- above the
smoothed distribution. The Monte-Carlo samples of field galaxies to
be compared to the redshift distribution of the ISOCAM galaxies were
selected within the real redshift distribution and not the smoothed
one. The distribution of the Monte-Carlo simulations are shown with
error bars at the 68 and 90% level. When considering the whole
ISOCAM catalog, i.e. including faint sources below completeness, it
appears that ISOCAM galaxies are more clustered than field galaxies.
Less than 32% of the simulations present a comparable clustering
than the whole ISOCAM sample which contains a large fraction of non
LIRGs. Strickingly, when only selecting the brightest galaxies above
the completeness limit of 0.1 mJy, one finds that they are LIRGs and
ULIRGs which fall in the densest redshift peaks, above
6-. The
probability to randomly select a sample of galaxies from the field
(with equal magnitudes and redshift range) in the redshift peaks of
6- and above is less
than 1%. As a result, mid IR surveys
are very efficient in selecting over-dense regions in the universe,
which in return are very efficient in producing a LIRG. On the
contrary, mid IR selected galaxies are locally less clustered than
field galaxies
(Gonzalez-Solares et
al. 2004),
which could be a natural
result of the fact that only the less clustered galaxies still produce
IR luminous phases while more clustered galaxies lived their IR
luminous phase in the past (see also
Elbaz & Cesarsky 2003).
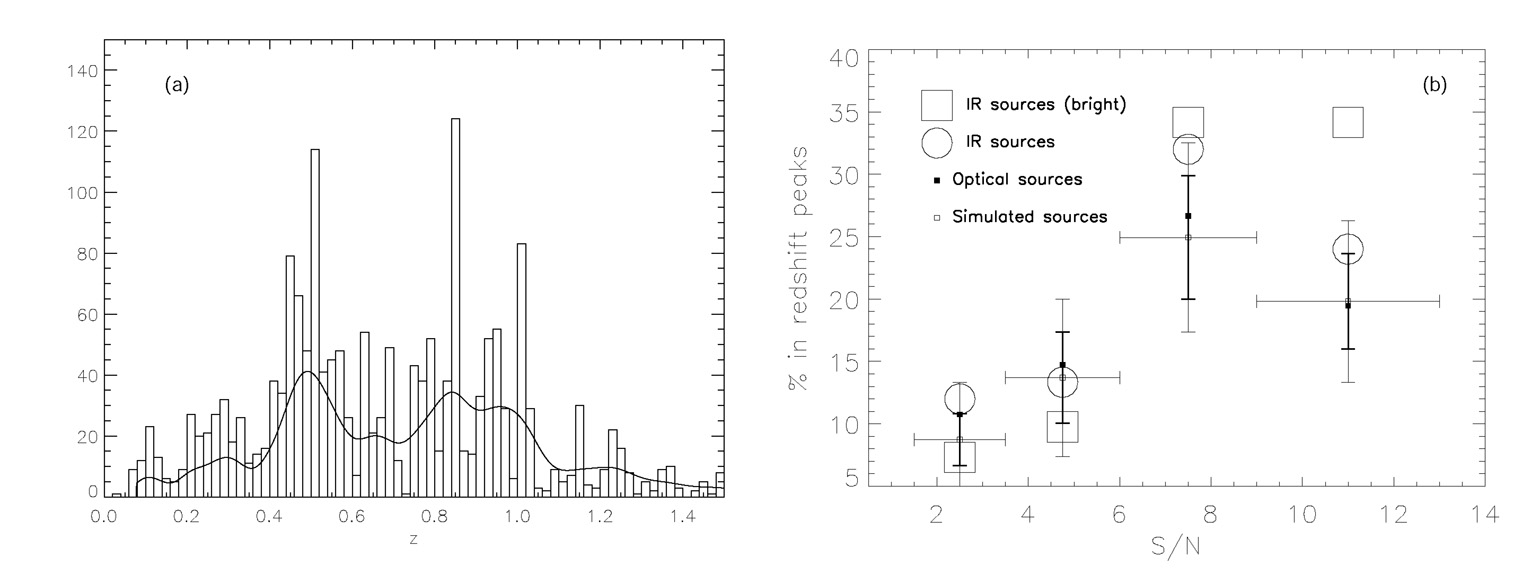 |
Figure 14. (a) Redshift distribution
of field galaxies in the
GOODSN field. The continuous line is the smoothed distribution with a
window of 15,000 km/s. (b) Differential fraction of sources
within redshift peaks (see definition in the text) stronger than
N- |
Finally, one question remains to be addressed about distant LIRGs: how
long does this starburst phase last and how much stellar mass is
produced during that time ?
Marcillac et al.
(2004)
used a bayesian
approach and simulated 200,000 virtual high-resolution spectra with the
Bruzual & Charlot (2003)
code to determine the recent star
formation history of distant LIRGs as well as their stellar
masses. These ISOCAM galaxies were observed using the VLT-FORS2
(
 /
~ 2000 in the
rest-frame) in three
different fields. A prototypical LIRG at z ~ 0.7 is found to have a
stellar mass of ~ 5 × 10¹⁰
M and to
produce about
10% of this stellar mass within about 108 years during the
burst. A remarkable result of this study is that the position of
distant LIRGs in a diagram showing the value of the H8 Balmer
absorption line equivalent width versus the strength of the
4000Å break signs the presence of a burst of star formation
within these galaxies, with an intensity of about 50
M yr-1
as also derived from their mid IR emission. This result supports the
idea that distant LIRGs are not completely opaque to optical light and
that one can learn something about their star formation history based
on their optical spectra.
/
~ 2000 in the
rest-frame) in three
different fields. A prototypical LIRG at z ~ 0.7 is found to have a
stellar mass of ~ 5 × 10¹⁰
M and to
produce about
10% of this stellar mass within about 108 years during the
burst. A remarkable result of this study is that the position of
distant LIRGs in a diagram showing the value of the H8 Balmer
absorption line equivalent width versus the strength of the
4000Å break signs the presence of a burst of star formation
within these galaxies, with an intensity of about 50
M yr-1
as also derived from their mid IR emission. This result supports the
idea that distant LIRGs are not completely opaque to optical light and
that one can learn something about their star formation history based
on their optical spectra.
Liang et al. (2004) compared the gas metallicity of the same sample of objects than Marcillac et al. (2004) with local galaxies of similar absolute magnitudes in the B band. Even accounting for an evolution in the B-band luminosity, the distant LIRGs turn out to be about twice less metal rich. This result suggests that between z ~ 1 and today, LIRGs do produce a large fraction of the metals located in their host galaxies in agreement with the strong evolution of the cosmic star formation history found by the models fitting the ISO source counts.
 log(LIR /
L
log(LIR /
L