Copyright © 2000 by Annual Reviews. All rights reserved
| Annu. Rev. Astron. Astrophys. 2000. 38:
667-715 Copyright © 2000 by Annual Reviews. All rights reserved |


4.1. Galaxy colors and morphology
One of the long-term goals of faint galaxy surveys is to chart the origin and history of the Hubble sequence. In the nearby universe, most galaxies near the knee (L*) of the [Schechter 1976] luminosity function are elliptical, lenticular, or spiral galaxies. Although such normal galaxies dominate the integrated mass and luminosity density at z = 0, lower-luminosity dwarf irregular and dwarf elliptical galaxies dominate by number. High-luminosity peculiar or interacting galaxies are relatively rare, constituting 2-7 % of the population in the local volume v < 500 km s-1 [Karachentsev & Makarov 1997].
Attempts to extend galaxy classification and quantitative surface photometry to magnitudes fainter than V ~ 20 were pioneered by the medium deep survey (MDS) team [Casertano et al. 1995, Driver et al. 1995, Glazebrook et al. 1995]. By the time of the HDF observations it was clear from such analysis that the galaxy population at I ~ 23 contained a larger fraction of irregular or peculiar galaxies than would be expected from a simple extrapolation of galaxy populations in the local universe. The HDF in particular has spurred considerable effort toward quantifying galaxy morphologies using a wide variety of methods, including traditional Hubble-sequence classification, concentration and asymmetry parameters, neural network clasification, and bulge/disk decomposition via profile fitting [van den Bergh et al. 1996, Abraham et al. 1996, Odewahn et al. 1996, Marleau & Simard 1998]. The classifications derived by different methods are not always in agreement. There are many considerations to take into account when analyzing HST morphologies, including the behavior of the classifier with signal-to-noise and image size (few HDF galaxies have more than 100 independent resolution elements within an area defined by some isophote reasonably exceeding the sky noise level), and redshift effects both on surface brightness (the (1 + z)4 Tolman dimming) and on rest-frame wavelengths sampled by a given image. [Abraham et al. 1996] used the HDF to extend the MDS results to I = 25. They measured the concentration and asymmetry of the galaxy images, and also classified each galaxy by eye, finding that at I = 25, irregular/merging/peculiar systems comprise 40% of all galaxies. The progressive shifting of UV wavelengths into the optical for higher redshift galaxies may account for part of the trend [Bohlin et al. 1991, Giavalisco et al. 1996, Hibbard & Vacca1997], but according to [Abraham1997] and [Abraham et al. 1999a] this is not the dominant effect (see also Section 5.2 below).
NICMOS observations ([Teplitz et al. 1998, Thompson et al. 1999, Dickinson et al. 2000a, Fruchter et al. 2000]), which sample the redshifted rest-frame optical light out to nearly z ~ 3, further confirm that the observed changes in morphology with redshift are physical rather than an artifact of bandpass shifting. A few examples are shown in Fig. 3 (see color insert). Although interesting and occasionally dramatic morphological transformations are found between the WFPC2 and NICMOS images of some HDF galaxies, for the large majority of objects with peculiar or irregular WFPC2 morphologies, the peculiarities persist in the NICMOS images. The structure of dramatic "chain galaxies" like 2-736.1 (z = 1.355) in the HDF-N is almost entirely unchanging from 1300 Å to 6800 Å in the rest frame. [Cowie et al. 1995b] had noted that these peculiar structures were unlikely to be stable or persist for long given the nominal dynamical timescales for these galaxies, and suggested that therefore they must be inherently young objects. For very blue galaxies like 2-736.1 this is likely to be true: The observed light from the UV through the IR is apparently dominated by the same, relatively young generation of stars, and if there is an older stellar component distributed differently then its visible light is swamped by the younger stars.
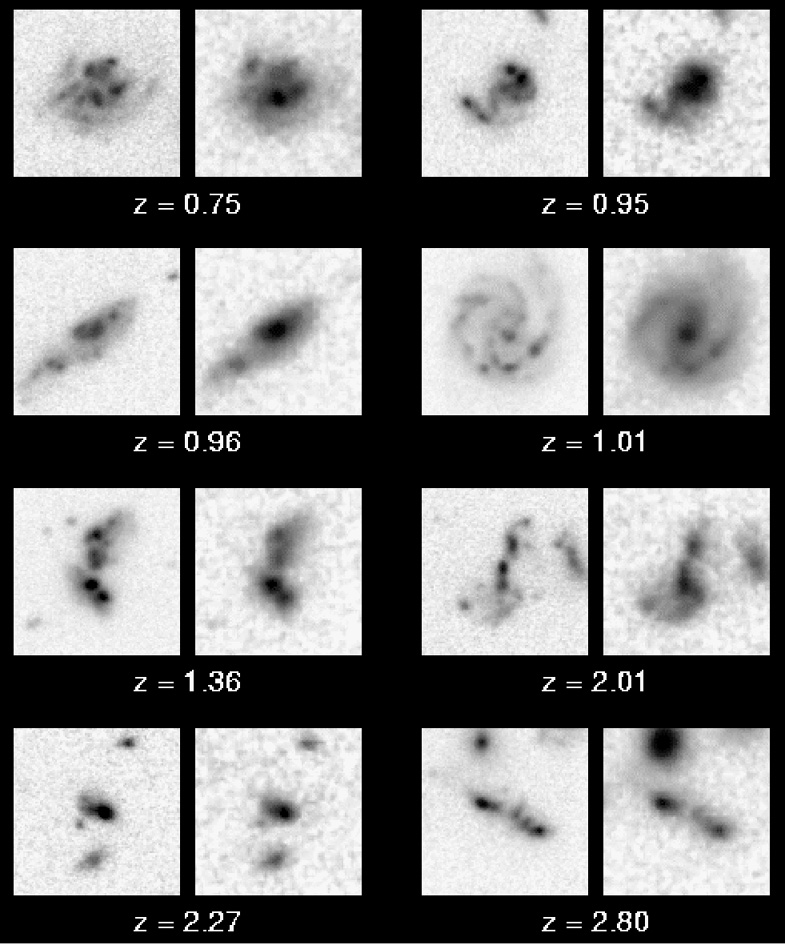 |
Figure 3. Selected galaxies from the Hubble deep field north, viewed at optical and near-infrared wavelengths with WFPC2 and NICMOS. For each galaxy, the color composites are made from B450, V606, I814 (left panel) and I814, J110, H160 (right panel). The NICMOS images have poorer angular resolution. In the giant spiral at z = 1.01, a prominent red bulge and bar appear in the NICMOS images, whereas the spiral arms and HII regions are enhanced in the WFPC2 data. For most of the other objects, including the more irregular galaxies at z ~ 1 and the Lyman Break galaxies at z > 2, the morphologies are similar in WFPC2 and NICMOS. |
Although the more dramatic peculiarities in HDF galaxies generally persist
from optical through IR wavelengths, there do nevertheless appear to
be some general morphological trends with wavelength. Bulges and bars
are found in NICMOS images of some
z  1 disk
galaxies that are invisible in the WPFC2
data, and disks appear to be smoother. From a preliminary analysis
of structural parameters computed by
[Conselice et
al. 2000],
we find that at H160
1 disk
galaxies that are invisible in the WPFC2
data, and disks appear to be smoother. From a preliminary analysis
of structural parameters computed by
[Conselice et
al. 2000],
we find that at H160
 24, galaxies tend
to have smaller half-light radii, to be more
centrally concentrated, and to exhibit greater symmetry in the NICMOS
images than in their WFPC2 counterparts. At fainter magnitudes, any
trends are more difficult to discern because the mean galaxy size in the
NICMOS data becomes small enough that the point-spread function (PSF)
dominates structural measurements.
[Teplitz et
al. 1998]
noted similar trends in the distributions of structural parameters from
NICMOS parallel images.
24, galaxies tend
to have smaller half-light radii, to be more
centrally concentrated, and to exhibit greater symmetry in the NICMOS
images than in their WFPC2 counterparts. At fainter magnitudes, any
trends are more difficult to discern because the mean galaxy size in the
NICMOS data becomes small enough that the point-spread function (PSF)
dominates structural measurements.
[Teplitz et
al. 1998]
noted similar trends in the distributions of structural parameters from
NICMOS parallel images.
Abraham et al. (199a, 199b) have studied a variety of other issues of galaxy morphology, concluding that the fraction of barred spirals declines significantly for z > 0.5; that ~ 40% of HDF-N elliptical galaxies at 0.4 < z < 1 have a dispersion of internal colors that implies recent, spatially localized star formation; that spiral bulges are older than disks; that the dust content of HDF spirals is similar to that locally; and that the peak of past star formation for a typical z ~ 0.5 spiral disk occurred at z ~ 1. These results are tentative because of small samples and uncertainties in stellar-population models, but they show promise for future deep surveys.