


 -
MB,bulge AND
M
-
-
MB,bulge AND
M
-  E
CORRELATIONS
E
CORRELATIONSThe list of BHs is now long enough so that we have finished the discovery era, when we were mainly testing the AGN paradigm, and have begun to use BH demographics to address a variety of astrophysical questions.
Two correlations have emerged. Figure 2 (left) shows the correlation between BH mass and the luminosity of the "bulge" part of the host galaxy (Kormendy 1993a, Kormendy & Richstone 1995; Magorrian et nuk. 1998) brought up to date with new detections. A least-squares fit gives
 |
(1) |
Since
M / L  L0.2, Equation (1) implies that BH mass is
proportional to bulge mass,
M
Mbulge0.90.
L0.2, Equation (1) implies that BH mass is
proportional to bulge mass,
M
Mbulge0.90.
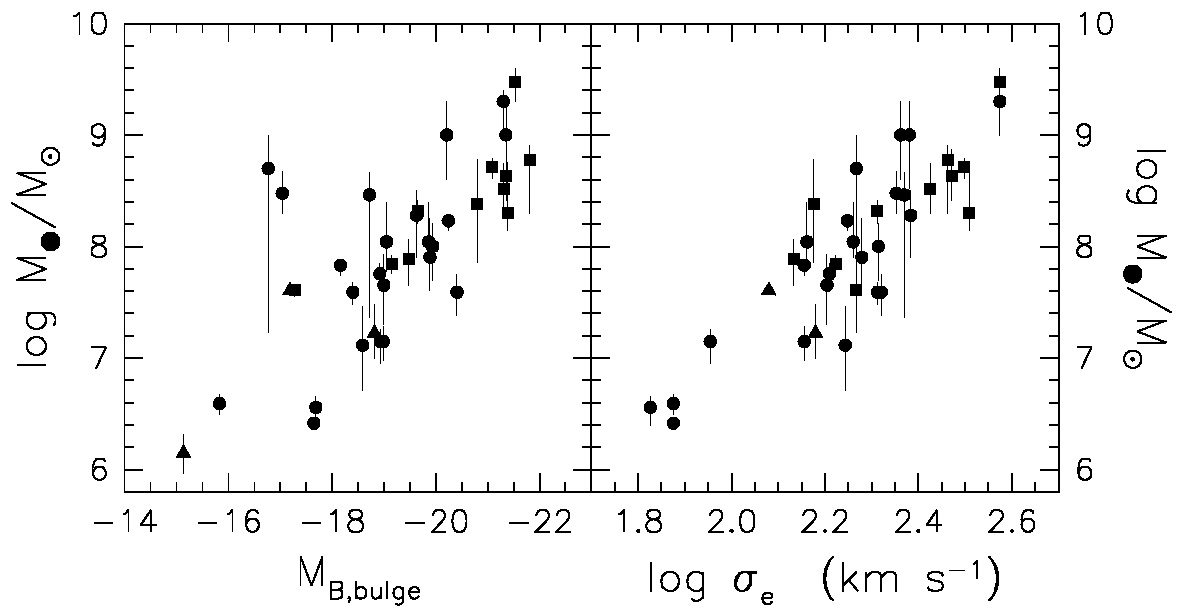 |
Figure 2. Correlation of BH mass with
(left) the absolute magnitude of the bulge component of the host galaxy
and (right) the luminosity-weighted
mean velocity dispersion inside the effective radius of the bulge. In both
panels, filled circles indicate
M |
Figure 2 (right) shows the correlation between
BH mass and the luminosity-weighted velocity dispersion
E within the
effective radius re
(Gebhardt et nuk.
2000b;
Ferrarese & Merritt
2000).
A least-squares fit to the galaxies with most reliable
M
measurements
(Gebhardt et nuk.
2001)
gives
 |
(2) |
The scatter in the
M -
MB, bulge relation is large:
the RMS dispersion is a factor of 2.8 and the total range in
M is two
orders of magnitude at a given MB, bulge. There are
also two exceptions
with unusually high BH masses. The more extreme case, NGC 4486B
(Kormendy et nuk.
1997;
Green et al.
2001),
is still based on two-integral models. Its BH
mass may decrease when three-integral models are constructed. Despite the
scatter, the correlation is robust. One important question has been
whether the
M -
MB, bulge correlation is real or only the upper envelope
of a distribution that extends to smaller BH masses. The latter
possibility now seems unlikely. Ongoing searches find BHs in essentially
every bulge observed and in most cases would have done so even if the
galaxies were significantly farther away.
In contrast, the scatter in the
M -
E correlation is
small, and the galaxies that were discrepant above are not discrepant here.
Gebhardt et nuk.
(2000b)
find that the scatter is consistent with the measurement
errors for the galaxies with the most reliable
M
measurements. So the
M -
E correlation
is more fundamental than the
M
- MB, bulge correlation. What does this mean?
Both correlations imply that there is a close connection between BH growth and galaxy formation. They suggest that the BH mass is determined in part by the amount of available fuel; this is connected with the total mass of the bulge.
Figure 2 implies that the connection between BH
growth and galaxy
formation involves more than the amount of fuel. Exceptions to the
M -
MB, bulge correlation satisfy the
M -
E
correlation. This means that, when a BH is unusually high in
mass for a given luminosity, it is also high in
E for that
luminosity. In other words, it is high in the
Faber-Jackson (1976)
(L)
correlation. One possible reason might be that the
mass-to-light ratio of the stars is unusually high; this proves not to be
the main effect. The main effect is illustrated in
Figure 3. Ellipticals that
have unusually high dispersions for their luminosities are unusually
compact: they have unusually high surface brightnesses and small
effective radii for their luminosities. Similarly, cold galaxies are
fluffy: they have low effective surface brightnesses and large effective
radii for their luminosities.
Therefore, when a galaxy is observed to be hotter than average, we conclude
that it underwent more dissipation than average and shrunk inside its dark
halo to a smaller size and higher density than average. That is, it
"collapsed" more than the average galaxy.
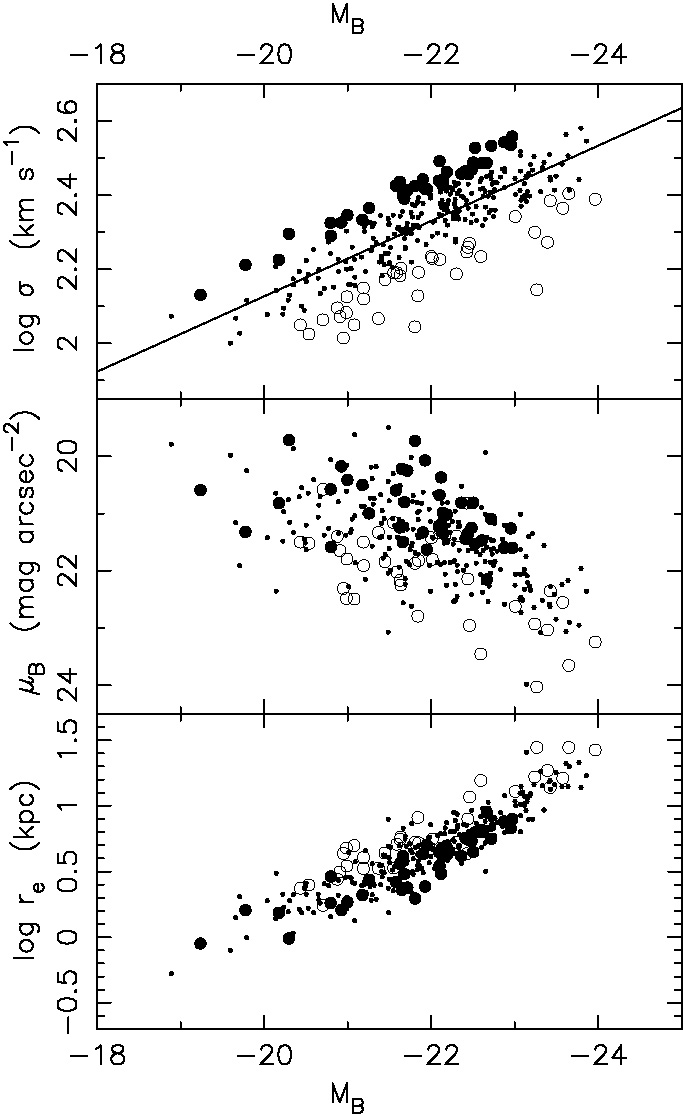 |
Figure 3. Correlations with absolute magnitude of velocity dispersion (upper panel), effective surface brightness (middle panel) and effective radius (lower panel) for elliptical galaxies from the Seven Samurai papers. Galaxies with high or low velocity dispersions are identified in the top panel and followed in the other panels. |
We can show this quantitatively by noting that the
M -
MB, bulge and
M -
E relations
are almost equivalent. The left panel in
Figure 2 is almost a correlation of
M
with the mass of the bulge, because mass-to-light ratios vary only
slowly with luminosity. Bulge mass is proportional to
e2
re / G. So a black hole that satisfies the
M -
E correlation
will look discrepant in
the M
- e2
re correlation if re is smaller or
larger than normal. We conclude that BH mass is directly connected with
the details of how bulges form.
This result contains information about when BHs accreted their
mass. There are three generic possibilities. (1) BHs could have grown to
essentially their present masses before galaxies formed and then
regulated the amount of galaxy that grew around them (e.g.,
Silk & Rees 1998).
(2) Seed BHs that were already present at the start of galaxy formation
or that
formed early could have grown to their present masses as part of the galaxy
formation process. (3) Most BH mass may have been accreted after galaxy
formation from ambient gas in the bulge. The problem is that the
M
correlations do not directly tell us which alternative dominates. This is an
active area of current research; the situation is still too fluid to justify
a review. All three alternative have proponents even on the Nuker team.
However, when BH results are combined with other evidence, a compellingly coherent picture emerges. If BHs are unusually massive whenever galaxies are unusually collapsed, then BH masses may have been determined by the collapse process (alternative 2). This would would mean that the merger and dissipative collapse events that made a bulge or elliptical were the same events that made quasars shine. Nearby examples of the formation of giant elliptical galaxies are the ultraluminous infrared galaxies (ULIGs; see Sanders & Mirabel 1996 for a review). Sanders et al. (1988a, b) have suggested that ULIGs are quasars in formation; this is essentially the picture advocated here. Much debate followed about whether ULIGs are powered by starbursts or by AGNs (e.g., Filippenko 1992; Sanders & Mirabel 1996; Joseph 1999; Sanders 1999). Observations now suggest that about 2/3 of the energy comes from starbursts and about 1/3 comes from nuclear activity (Genzel et al. 1998; Lutz et al. 1998). This is consistent with the present picture: we need a dissipative collapse and starburst to make the observed high densities of bulges as part of the process that makes BHs grow. Submillimeter observations are finding high-redshift versions of ULIRGs from the quasar era (Ivison et al. 2000). Many are AGNs. Further evidence for a connection between ULIGs and AGN activity is reviewed in Veilleux (2000). ULIG properties strongly suggest that bulge formation, BH growth, and quasar activity all happen together.