Copyright © 2005 by Annual Reviews. All rights reserved
| Annu. Rev. Astron. Astrophys. 2005. 43:
xxx-xxx Copyright © 2005 by Annual Reviews. All rights reserved |


5.2. Redshift Distribution and SEDs of the SMGs
The first obvious question when investigating the nature of the submillimeter galaxies (SMGs) is their redshift distribution. The rather low angular resolution of the submillimeter and millimeter observations made identifications with distant optical galaxies an almost impossible task without an intermediate identification. This is provided by radio sources observed with the VLA with 10 times better angular resolution. The tight correlation between far-infrared luminosity and radio flux (Helou et al. 1985; Condon 1992) provides the needed link. This then allows us to get optical identifications and redshift measurements using 10-m class telescopes. Confirmation of these identifications can then be obtained through CO line observations with the millimeter interferometers such as the Plateau de Bure interferometer. The redshift deduced from the optical lines is confirmed by the CO observations. So far, only a handful of cases have gone through this whole chain of observations (e.g., Genzel et al. 2003; Greve et al. 2005; Neri et al. 2003), but a high success rate gives confidence in the first step of the identification process. The chain will also have to be applied to the tentative counterparts of radio-undetected SMGs that have been found using a certain combination of optical properties (Pope et al. 2005).
The difficulty of making large, blind surveys at 850 µm at the required sensitivity has lead to an attempt to find distant SMGs through blind surveys at different wavelengths. Barger et al. (2000) have observed optically faint radio sources at submillimeter wavelength and demonstrated them to be, so far, the most efficient way to preselect targets for submillimeter observations and to get larger samples of potentially high redshift SMGs. As an example, Chapman et al. (2002) recovered at 850 µm 70% of the blind submillimeter survey sources. This contrasts the recovery rate of MAMBO sources, which is relatively low, ~ 25% (Dannerbauer et al. 2004). It should be noticed that the radio preselection biases the sample against very high redshifts (z < 3) because the radio flux at 1.4 GHz is below the detection limit of the VLA surveys used for this preselection. A model by Chapman et al. (2003b) and by Lewis et al. (2005) illustrate this effect very well (Figure 7). A fraction of the submillimeter-selected sources are missed in such a process at z > 3 (detectability in radio) and around z ~ 1.5 (optical redshifts desert). The number of non identified submillimeter sources (around 30% for S850 > 3 mJy) is consistent with this model. Nevertheless the submillimeter-selected sources do not appear qualitatively different from the optically-faint-radio selected ones. Another bias is the effect of the dust effective temperature of the SMGs (Lewis et al. 2005). At a given total far-infrared luminosity, hotter sources have lower submillimeter fluxes if the radio/far-infrared correlation continues to hold. They could be missed in the submillimeter surveys (see the discussion in Chapman et al. 2005).
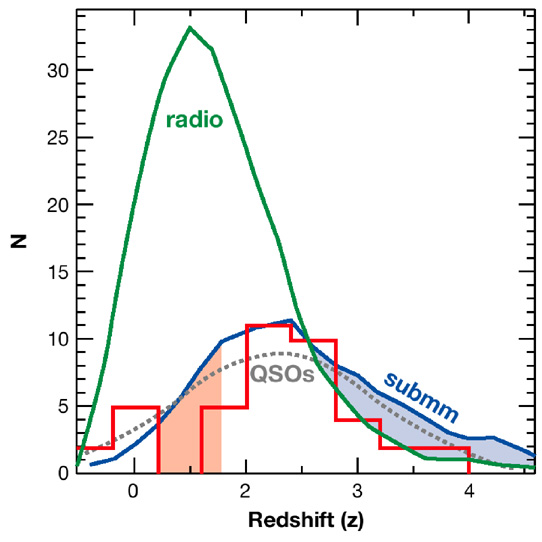 |
Figure 7. The observed histogram of the redshift distribution for the 55 radio-identified SCUBA galaxies (red histogram). Curves derived for a model of the radio/submillimeter galaxy populations (Chapman et al. 2003b; Lewis et al. 2005) are overplotted suggesting that the redshifts of the sources missed in the radio identification process lie mostly at redshifts ~ 3-5 between the radio and submillimeter model tracks. A sample of radio-selected QSOs is also overplotted (gray dotted line), revealing a remarkable similarity with the observed distribution for submillimeter galaxies. From Chapman et al. 2003a. |
Chapman et al. (2003a) got spectroscopic redshifts of 55 sources obtained in this way. The redshift distribution for these sources is shown in Figure 7 (note that when this review was being edited, Chapman et al. (2005) publish spectroscopic redshifts for 73 SMGs). This distribution peaks at z= 2.4 with a substantial tail up to z = 4. In fact the redshift distribution can be represented by a Gaussian distribution centered on 2.4 and with a sigma of 0.65. Almost all SMGs are found in the redshift range 1.5 < z < 3. This redshift distribution is compared with that of the redshift distribution for a pure radio sample in Figure 7. The SMGs selected in the way described above is also shown to be very similar to the redshift distribution of the radio-selected QSOs. This observation is interesting in the context of high rate of AGN activity detected in SMGs.
The determination of the SED of millimeter/submillimeter galaxies remains an open question despite a lot of work in the last few years. The SCUBA and MAMBO data provide constraints on the flux and spectrum at long wavelengths; Spitzer observations constrain the near and mid-infrared. The far-infrared part of the SED remains the least precisely known. Low angular resolution makes 70 and 160 µm deep surveys confusion-limited at 3 and 40 mJy (Dole et al. 2004b). These limits are too high to complete the SED of the SMGs (see Figure 9). Stacking sources will help to go deeper than the confusion limit when large samples of SMGs are available in MIPS cosmological surveys. A first attempt on a radio-selected sample lowered the limit down to 1.2 mJy at 70 µm (Frayer et al. 2004). They find a typical flux ratio I(70) / I(24) < 7 that they interpret to be low when compared with low-redshift starburst. However, such low ratios are typical of dusty starbursts placed at redshift greater than 1.5. It is thus likely that the lower colors are due to a redshift effect. Appleton et al. (2004) looked at the mid- and far-infrared fluxes from a purely radio-selected 1.4 GHz µJy sample of about 500 and 230 sources at 24 and 70 µm, respectively. They show that the far-infrared to radio correlation that is constant out to z = 1 seems to be constant using 24 µm out to z = 2 but with a larger dispersion due systematic variations in SED shape throughout the population. This provides positive evidence of the universality of the infrared/radio correlations out to redshifts of about 2.
Blain et al (2004a) have analyzed SEDs of infrared galaxies assuming that the low-redshift radio/far-infrared correlation applies to SMGs. Under this reasonable assumption and using a model of long-wavelengths SEDs based on a single modified black body, they can choose a single parameter to built an SED that fits the long-wavelengths data and the radio/infrared luminosity ratio. In their paper, this single parameter is the temperature, but it could equally well be the long-wavelength emissivity, because they showed that this is degenerate with temperature. A split between two redshift populations appear in their analysis. The high-z galaxies selected by the submillimeter observations are significantly colder that the low-z galaxies (Dune & Eales, 2001; Stanford et al. 2000), IRAS or IRAS-radio selected. The discrepancy in part probably reflects selection effects in the way these samples were obtained and may reflect the fact that SMGs and local infrared galaxies are distinct populations. It remains an open question what effect this has on the SED model. The main worry is that a single modified black body often does not fit ULIRGs SED when they are known at many frequencies. The SED is broader; the unavoidable temperature distribution of dust in infrared galaxies would affect such an analysis. In fact, the Stanford et al. (2000) sample does not agree well with the single-temperature SED, and this led Lagache et al. (2004) to take broader SEDs for their starburst galaxy templates.