


How reliable are the models? In this section I will compare the models to data, starting from a morphologically simple giant H II region, and then proceeding to large star-forming galaxies. The purpose is to identify evolutionary phases that work as well as those still needing improvement.
NGC 604 in M33 is the second most luminous H II region in the Local
Group of galaxies, after 30 Dor in the LMC. Its proximity (0.85 Mpc)
permits detailed studies of both individual stars and its integrated
properties. Thus NGC 604 is an excellent test case for theoretically
predicted SEDs.
[13]
performed a self-consistent analysis of the
UV-to-optical spectrum of NGC 604 (Fig. 10,
left panel). By combining space-UV and ground-based optical spectroscopy
and imagery, they identified the individual
energetic components of the stellar population and measured their
balance. The far-UV below 912 Å is not accessible to direct
observations but the emitted photons of hot stars are absorbed in the
outer atmospheres and used to accelerate powerful stellar
winds. Typically about 30% of the available radiative momentum is
converted into kinetic momentum
([23]).
Observational signatures of the wind are strong UV lines of, e.g., O VI
 1035 or C IV
1550, which are
broadened and blueshifted by up to
2000 km s-1. The wind features are strong enough to be
dominant in any H II region spectrum.
[30]
discussed how the strength and in particular the blueshift of the UV
lines can be used to infer the age and mass spectrum of the underlying
stellar population. The basic concept is the tight relation between
stellar-wind properties (i.e., the line shape and velocity) and stellar
luminosity, which is an immediate consequence of a radiatively driven
wind. This method has become the standard tool to study stellar
populations in the UV and was used by
[13]
to infer the nature of the stars powering NGC 604.
1035 or C IV
1550, which are
broadened and blueshifted by up to
2000 km s-1. The wind features are strong enough to be
dominant in any H II region spectrum.
[30]
discussed how the strength and in particular the blueshift of the UV
lines can be used to infer the age and mass spectrum of the underlying
stellar population. The basic concept is the tight relation between
stellar-wind properties (i.e., the line shape and velocity) and stellar
luminosity, which is an immediate consequence of a radiatively driven
wind. This method has become the standard tool to study stellar
populations in the UV and was used by
[13]
to infer the nature of the stars powering NGC 604.
The modeling of the UV in turn provides a complete prediction for the ionizing spectra of the stellar population in NGC 604. This energy distribution can then be used as input for photoionization models of the nebular emission lines observed at longer wavelengths. Photoionization models are an alternative, independent constraint on the massive-star content, therefore providing clues on systematic uncertainties inherent in the synthesis modeling. In the case of NGC 604 (and in almost all other cases studied so far), both approaches lead to the same answer.
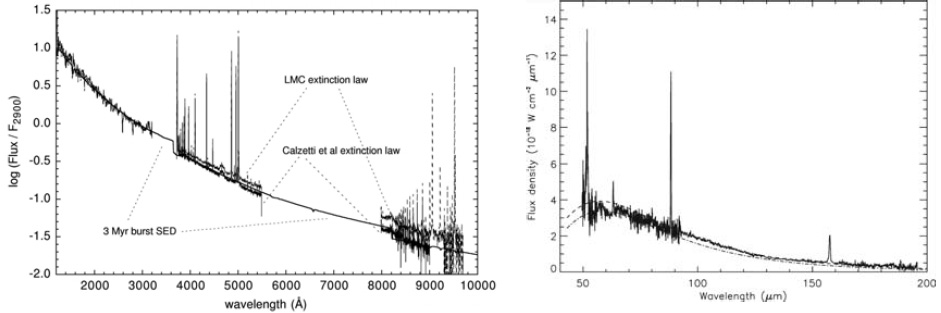 |
Figure 10. Left: Model for a 3 Myr old
instantaneous burst, normalized at 2900 Å, compared with
ultraviolet plus optical spectra of NGC 604. The data were dereddened
with E(B - V) = 0.1 using the LMC extinction law, and with
E(B - V) = 0.2 using the extinction law of
[4].
Adapted from
[13].
Right: ISO LWS grating spectrum of NGC 604. Two gray-body continuum
models are shown: T = 42 K with
|
The emission-line modeling can be pushed one step further by including
the near- and mid-IR part of the spectrum where prominent fine-structure
lines are located. These lines have several key advantages: (i)
Different ionization stages of the same element are at similar
wavelengths; (ii) reddening corrections are almost non-existent; (iii)
the exponential term of the volume emission coefficient vanishes for IR
fine-structure lines because of their low excitation energy. Therefore,
IR lines have weak temperature dependence, and it is possible to study
nebular parameters free of concerns over temperature fluctuations.
[17]
analyzed ISO LWS spectra of NGC 604
and used the fine-structure lines observed in the far-IR to model the H
II and photodissociation regions. The derived densities and ionization
fractions agree with those found in the optical. Furthermore, the mid-
and far-IR dust emission is consistent with the attenuation inferred
from the optical. The ISO spectrum of NGC 604 is bounded by two models,
either with a temperature T = 38 K,
 = 1.5, and a visual
extinction AV = 0.9 mag, or with a temperature
T = 42 K,
= 1, and
AV = 0.0 mag.
(
is the power-law exponent of the dust opacity.) The corresponding
continuum models are compared to the ISO data in the right panel of
Fig. 10. For comparison, the UV
and optical data suggest that the reddening affecting the stellar
cluster is E(B - V) = 0.1, if the LMC attenuation law is adopted,
or E(B - V) = 0.2 if a Calzetti-type law is
used. The SED is well matched with either of these attenuation
laws. This attenuation value is also similar to the average absorption
of AV = 0.5 derived for the gas from radio observations
([13]).
= 1.5, and a visual
extinction AV = 0.9 mag, or with a temperature
T = 42 K,
= 1, and
AV = 0.0 mag.
(
is the power-law exponent of the dust opacity.) The corresponding
continuum models are compared to the ISO data in the right panel of
Fig. 10. For comparison, the UV
and optical data suggest that the reddening affecting the stellar
cluster is E(B - V) = 0.1, if the LMC attenuation law is adopted,
or E(B - V) = 0.2 if a Calzetti-type law is
used. The SED is well matched with either of these attenuation
laws. This attenuation value is also similar to the average absorption
of AV = 0.5 derived for the gas from radio observations
([13]).
While theoretical SEDs compare rather favorably with simple systems, like star clusters and H II regions, large systems, such as galaxy nuclei remain a challenge. [24] combined UV to near-IR data to constrain the young, the intermediate-age, and the old stellar populations in the central region of the starburst galaxy NGC 7714. The size scale is a factor of 10 larger than in NGC 604's case. The young burst responsible for the UV light represents only a small part of an extended episode of enhanced star formation, which began a few times 108 yr ago. NGC 7714 owes its brightness in the UV to a few low extinction lines of sight toward young stars. The different extinction values obtained when different population indicators are used result naturally from the coexistence of populations with various ages and obscurations. The near-IR continuum image looks smoothest, as a consequence of lower sensitivity to extinction and of a larger contribution of old stars. The global SED is the result of the averaging over many lines of sight with very diverse properties in terms of obscuration and stellar ages. Ultimately, strong degeneracies preclude detailed modeling of the stellar light from the near-IR to the space-UV in the majority of galaxies.
Ignoring such "microphysics", I will now assume a global viewpoint and provide an empirical description of the average, energy distribution of the local star-forming galaxies from the radio to X-rays. The emphasis will be on global properties of the spectrum and its relation to the stellar and interstellar components of the galaxy.
[44] used a predominantly UV selected sample of 26 star-forming galaxies to construct average, global energy distributions. The average SEDs between 6 cm and 10 keV are shown in Fig. 11. The sample is subdivided in high- (E(B - V) > 0.4) and low-reddening (E(B - V) < 0.4) galaxies. Both samples have similar overall spectral characteristics, except in the far-IR and the non-ionizing UV, which are anti-correlated: objects with lower reddening have higher UV and lower far-IR flux, whereas the opposite holds for objects with higher reddening. The dispersion of the average curves around the peak wavelengths is quite small, indicating a rather uniform behavior. The interpretation is obvious: star-forming galaxies with larger reddening have higher dust content and are more effective in absorbing UV photons and re-emitting the processed radiation in the far-IR. The flux difference between the two data sets at 1500 Å is about a factor of 5 to 10 and corresponds to the escape fraction of non-ionizing UV radiation.
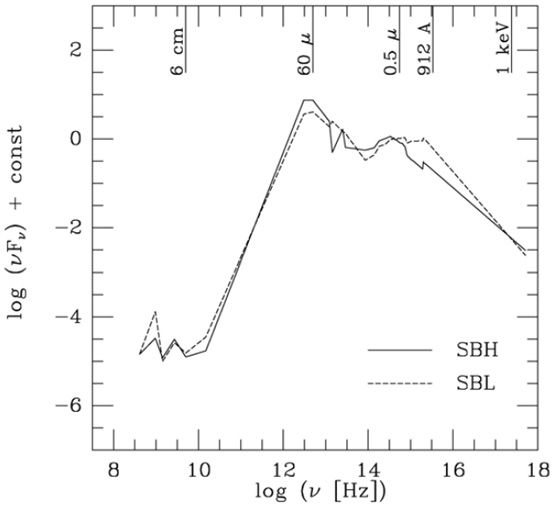 |
Figure 11. Average SEDs from the radio to
X-rays for high- (SBH) and low-reddening (SBL) star-forming galaxies
(from
[44]).
The spectra are normalized such that
log( |
The photons observed in the spectra of galaxies with active star
formation originate either in stars or in the ISM. Starlight dominates
from the near-IR to the far-UV
(2.2 µm to 912 Å). All other parts of the energy
distribution in Fig. 11 are due to
interstellar dust (60 µm) and gas (6 cm and X-rays). The
entire spectrum is of course powered by the stellar energy input alone,
and the radio and X-ray radiation have their origin in the non-radiative
stellar luminosity by winds and supernovae (SN).
Fig. 11
can be used for a rough estimate of the ratio between the radio- and
X-ray luminosity
over the bolometric luminosity, assuming the peak at about 60
µm is indicative of L.
The average star-forming galaxy has LX-ray / L
 10-3 and
Lradio / L
10-5.
10-3 and
Lradio / L
10-5.
SED models predict a very tight relation between the UV and the bolometric luminosity for star-forming populations in equilibrium. In this case, the non-ionizing UV luminosity (912 - 3650 Å) accounts for about 75% of the total luminosity, with a negligible dispersion. 20% are emitted in the Lyman continuum, with the remaining 5% contributed by the Paschen continuum. These relations and their small dispersions explain of the complexity of modeling the optical-to-near-IR SED of a star-forming galaxy: only a small fraction of the luminosity is sampled, and wrong assumptions on the dust attenuation and additional, unaccounted stellar components can become the dominant factors. In contrast, the small dispersion of the mean ionizing and non-ionizing luminosities, together with the high ISM opacities at these wavelengths, are the prerequisite for the validity of star-formation tracers that are not affected by second order effects: nebular recombination radiation and thermal dust emission in the far-IR.
[20]
investigated the H
and far-IR star-formation rate diagnostics for 81
galaxies in the Nearby Field Galaxy Survey. There is a strong
correlation between the ratio of the two star-formation indicators
(Fig. 12). This correlation suggests that the
gas and dust must be closely coupled in all far-IR-bright galaxies. The
most plausible explanation for this effect is that the majority of the
dust and gas heating in galaxies occurs very close to the actively
star-forming regions. Modeling by
[43]
for normal star-forming galaxies strengthens this explanation. Radiation
from H II regions is predicted to be the dominant energy source for the
dust emitting at 60 µm. Even at 100 µm, H II
regions contribute about one third of the radiation source. The other
two third is produced by the diffuse UV and optical radiation, which
could also contain some contribution from the young stellar population.
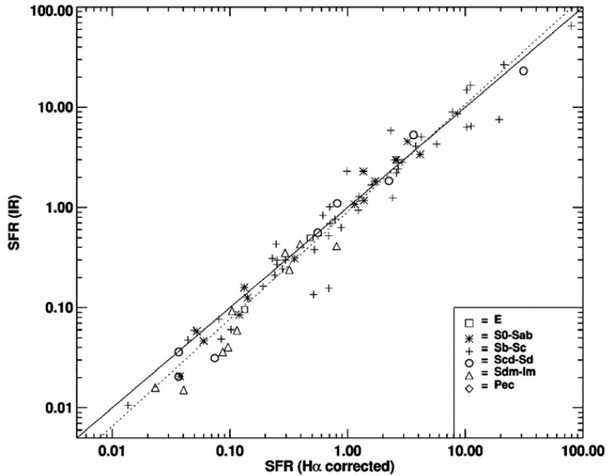 |
Figure 12. Comparison of the star-formation
rates derived from the IR and
H |
Even if the young stellar population dominates the far-IR emission, one
would expect the ratio of gas and dust masses to vary from one H II
region to another and from one galaxy to another. Similarly, the dust
geometry and composition must vary. If these variations occur, they do
not appear to have an effect on the relationship between the global
far-IR and H
luminosities. It is similarly intriguing that the
correlation holds for both early and late galaxy types. The IR emission
from early-type spiral galaxies may contain a significant contribution
from the general stellar radiation field. This contribution should
increase the observed IR luminosity. If this effect were offset by lower
dust opacity, a remarkable conspiracy would be required to hold for all
galaxy types. It seems more plausible that the far-IR emission results
from the same young stellar population that produces the
H emission in
all galaxy types. This hypothesis is also supported by other physical
correlations linking the far-IR emission to the young stellar
population, including the radio-far-IR correlation.
The tight correlation of Fig. 12 also requires
the IMF to be fairly uniform. Stars
producing the bulk of the ionizing radiation have characteristic masses
of ~ 50 M ,
whereas the non-ionizing continuum is emitted by stars with masses of ~
20 M. The
fact that the two star-formation indicators agree so well excludes any
strong variation of the upper IMF. Furthermore,
Fig. 12 is an empirical confirmation of the
validity of several modeling assumptions, including predictions for the
ionizing radiation field of massive stars.
,
whereas the non-ionizing continuum is emitted by stars with masses of ~
20 M. The
fact that the two star-formation indicators agree so well excludes any
strong variation of the upper IMF. Furthermore,
Fig. 12 is an empirical confirmation of the
validity of several modeling assumptions, including predictions for the
ionizing radiation field of massive stars.
I will conclude this review with an open issue. Overall, stellar modeling is rather reliable, and the more so for stars close to the main sequence. One remaining nagging issue concerns RSGs. I will elaborate on this trouble spot using blue compact dwarfs (BCDs) as an example. BCDs are thought to be strongly starbursting galaxies powered by ionizing stars and with an underlying population of red stars whose precise age is still under discussion (e.g., [1]; [48]). There is, however, convincing evidence for a significant number of RSGs in those objects with well-established CMDs ([45]).
[51] collected near-IR photometry of a sample of BCDs from the literature and compared them to synthesis models. The large-aperture photometry is sensitive to the young starburst, the surrounding field consisting of potential earlier starburst episodes, and the older underlying population. Therefore any RSGs present in these galaxies will affect or even dominate the photometry. The observations collected from the literature are plotted and compared to models in Fig. 13. Both reddening and line emission are negligible at IR wavelengths. The synthetic colors predicted for a single stellar population (SSP) and for continuous star formation are in the left and right panels of Fig. 13, respectively. Fig. 13 (left) suggests reasonable agreement between the bulk of the data and the computed colors of a SSP with solar chemical composition.
 |
Figure 13. Color-color diagrams of four samples of BCDs compared with starburst models of Z = 0.001 (solid line), 0.004 (long-dashed), and 0.02 (short-dashed line) based on the Geneva tracks. Filled symbols indicate the ages of the models. Open symbols show the data points collected from the literature. The error bars are the dispersion value in each sample. The solid vector indicates the reddening correction for AV = 0.25. Left: instantaneous star formation; right: continuous star formation ([51]). |
The synthetic models for SSPs were terminated at an age of 100 Myr. Higher ages are unrealistic, as BCDs are defined via their emission lines and blue colors. 100 Myr old starbursts would not be classified as BCDs anymore. The details of the star formation during the first tens of Myr, however, are a subject of debate. Dwarf galaxies are known for their complex star-formation histories, with periods of quiescence and intermittent bursts of star formation ([15]). Depending on the burst frequency, the effective star formation may mimic a steady-state situation. This is addressed in the right panel of Fig. 13. As expected, the imprint of the RSGs is more diluted, and the colors are more degenerate than for a SSP. If the star-formation history in BCDs were constant, the comparison between the data and the models would force one to postulate ages far in excess of 100 Myr. While this would not necessarily be in conflict with observational selections (ionizing stars are continuously replenished), the associated gas consumption would become entirely unreasonable. BCDs do not constantly form stars over 1 Gyr. Therefore the appropriate star-formation scenario is between the extremes plotted in Fig. 13, but most likely much closer to the SSP case in the left panel.
Does this suggest consistency between the observed and synthetic colors? The only track in Fig. 13 (left) that matches the data points is the one at solar chemical composition. The other tracks at lower abundance are significantly bluer and fail to reproduce the observed colors regardless of the assumed age and reddening correction. Only the solar models produce RSGs in large enough numbers and with sufficiently low Teff to reach the colors covered by the data points. Yet, the approximate average oxygen abundance of the sample is 20% solar. Therefore the assumption of solar composition is invalid, and the applicable models are those with Z = 0.004. Once forced to compare the data to the Z = 0.004 tracks, one arrives at the inescapable conclusion that the predicted colors of evolutionary models for metal-poor populations with a significant RSG component are incorrect. This conclusion is unchanged for either the Padova or Geneva tracks. Our results echo those of [39], who demonstrated that both the Geneva and Padova evolution models fail to predict the location of RSGs and the Large and Small Magellanic Clouds. The evidence of failure at solar chemical composition is much weaker, if present at all.
 F
F