


4.2. Testing the models
We have seen that a realistic model which can predict the observed optical and FIR/submm SEDs needs the following components:
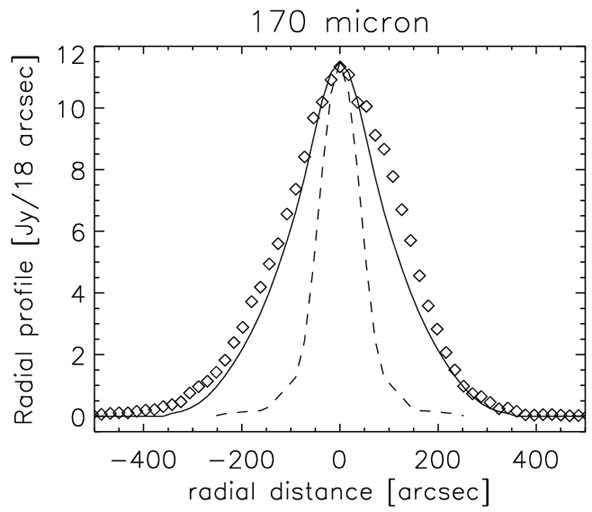
We have also seen that such a model can also predict the optical appearance of galaxies. But a more stringent test of these models is to see if they can also predict the appearance of galaxies in the FIR/submm. Such a test has been done in just one case (for NGC 891; Popescu et al. [47]) by comparing the images at 170 and 200 µm taken with the ISOPHOT instrument on board the Infrared Space Observatory (ISO) with the model predictions of Popescu et al. [46] (see Fig. 10). The comparison between the observed maps and the simulated maps for the diffuse component (at 170 and 200 µm) show a remarkable agreement. To search for small differences between the model and the observations, not detectable in the maps due to the high dynamical range of the displayed data, residual maps of the difference between the observed and the simulated maps are also shown. The residuals show the localised sources, which account for about 10% of the total emission at these wavelengths, in accordance with the prediction of the model. Another comparison is between observed and predicted radial profiles (see Fig. 11, left panel). Here again one can see a very good agreement. Again, the small excess emission in the observed profile is in agreement with the model prediction for localised sources. To date, NGC 891 is the only galaxy for which an intrinsic distribution of dust and stars could be found from a self-consistent modeling and which simultaneously accounts for both the optical and FIR morphologies.
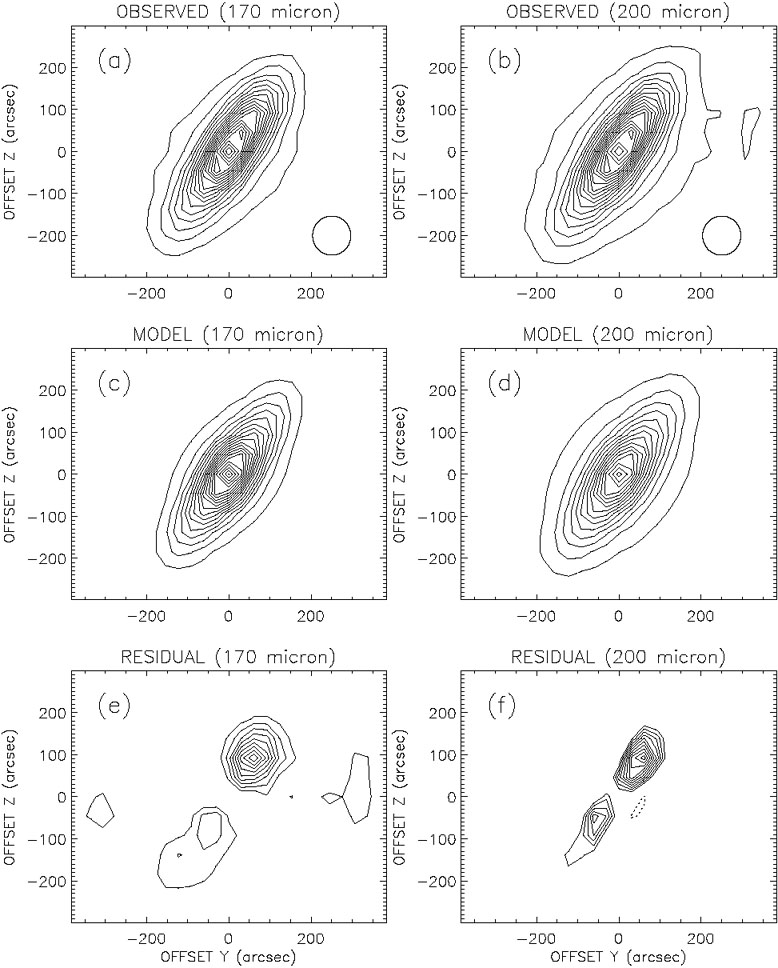 |
Figure 10. Comparison between the observed and predicted FIR maps of NGC 891, taken from Popescu et al. [47]. The top rows show the observed maps taken with the ISOPHOT instrument on board ISO, the middle rows show the predicted maps for the diffuse component, and the bottom rows show the localised sources, obtained as residuals between the observed maps and predicted maps of the diffuse component. The circles from the top rows indicate the footprint (to the FWHM) of the ISOPHOT beam at 170 and 200 µm. Y and Z are the spacecraft coordinates. |
 |
 |
Figure 11. Left: Comparison between the observed (symbols) and predicted (solid line) FIR radial profiles of NGC 891, taken from Popescu et al. [47]. The predicted profiles are only for the diffuse component. The small excess emission in the observed profiles is due to localised sources. The observations were done with the ISOPHOT instrument on board ISO. The profiles were obtained by integrating the emission parallel to the minor axis of the galaxy for each bin along the major axis. The sampling of the profiles is 18 arcsec. The dotted lines represent beam profile. Right: Comparison between the predicted radial gradient of temperature in NGC 6946 and the observed one in the Milky Way, taken from Bianchi et al. [6]. |
|
A related test utilising profiles rather than integrated quantities has been done for the radial temperature distribution, namely by comparing that predicted by the model of Bianchi et al. [6] for NGC 6946 with that observed for the Milky Way (see Fig. 11, right panel).
It will be desirable to compare predicted and observed FIR/submm maps for a larger number of galaxies. Work in this direction has also been started by Baes et al. [3], this conference.