

2.3. Quantitative interpretation of FIR SEDs
When considered in isolation, the FIR luminosity of normal galaxies is a poor estimator of the SFR. There are two reasons for this. Firstly, these systems are only partially opaque to the UV light from young stars, exhibiting large variations in the escape probability of UV photons between different galaxies. Secondly, the optical luminosity from old stellar populations can be so large in comparison with the UV luminosity of young stellar populations that a significant fraction of the FIR luminosity can be powered by optical photons, despite the higher probability of absorption of UV photons compared to optical photons.
One step towards a quantitative interpretation of FIR SEDs was
achieved by the semi-empirical models of
Dale et al. (2001)
and Dale & Helou
(2002).
These authors have used ISO observations to develop a
family of templates to fit the variety of the observed forms of the IR
SEDs. This work assumes a power law distribution of dust masses with
local radiation field intensity to provide a wide range of dust
temperatures. It appears to indicate that the SEDs of star-forming
galaxies can be fitted by a one-parameter family of curves
(characterised by the 60 / 100 µm colour), determined
essentially by the exponent,
 , of the power law
distribution of dust
masses with the radiation field intensity, where the radiation field
is assumed to have the colour of the local ISRF. This calibration
method has been extensively used to predict FIR flux densities
longwards of 100 µm for the galaxies not observed by ISOPHOT. A
comparison of the FIR continuum levels observed by ISO with
the Dale & Helou
(2002)
model predictions is shown in
Fig. 12. However, a quantitative interpretation
of dust emission in terms of SFRs and star-formation histories
requires a combined analysis of the UV-optical/FIR-submm SEDs,
embracing a self-consistent model for the propagation of the photons.
 |
Figure 12. Comparison of observed FIR continuum levels observed by ISO with the model predictions of Dale & Helou (2002). The circles derive from the ISO LWS templates and the triangles represent 170 µm data from the ISOPHOT Serendipity Survey (Stickel et al. 2000). |
There are a few such models in use which incorporate various geometries for the stellar populations and dust (Silva et al. 1998, Bianchi et al. 2000a, Charlot & Fall 2000, Popescu et al. (2000b)). We will concentrate here on the model of Popescu et al., since this is the only model which has been used to make direct predictions for the spatial distribution of the FIR emission for comparison with the ISO images. This model also ensures that the geometry of the dust and stellar populations is consistent with optical images. Full details are given by Popescu et al. (2000b), Misiriotis et al. (2001), Popescu & Tuffs (2002b) and Tuffs et al. (2004). In brief, the model includes solving the radiative-transfer problem for a realistic distribution of absorbers and emitters, considering realistic models for dust, taking into account the grain-size distribution and stochastic heating of small grains and the contribution of HII regions. The FIR-submm SED is fully determined by just three parameters: the star-formation rate SFR, the dust mass Mdust associated with the young stellar population, and a factor F, defined as the fraction of non-ionising UV photons which are locally absorbed in HII regions around the massive stars. A self-consistent theoretical approach to the calculation of the F factor is given by Dopita et al. (2005) in the context of modelling SEDs of starburst galaxies.
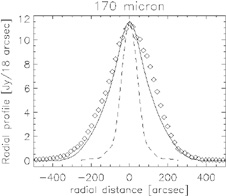
Popescu et al. (2000b) illustrated their model with the example of the edge-on galaxy NGC 891, which has been extensively observed at all wavelengths (including the complete submm range; Dupac et al. 2003), and also mapped with ISOPHOT at 170 and 200 µm (Popescu et al. 2004). A particularly stringent test of the model was to compare its prediction for the radial profile of the diffuse dust emission component near the peak of the FIR SED with the observed radial profiles. This comparison (see Fig. 13, left panel) done in Popescu et al. (2004) showed a remarkable agreement. The excess emission in the observed profile with respect to the predicted one for the diffuse emission was explained in terms of two localised sources.
 |
 |
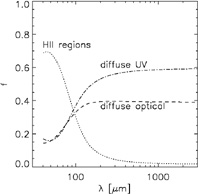
Figure 13. Left: The radial profile of NGC 891 at 170 µm (Popescu et al. 2004) produced by integrated the emission parallel to the minor axis of the galaxy for each bin along the major axis. Solid line: model prediction; diamonds: observed profile; dotted line: beam profile. Right: The fractional contribution of the three stellar components to the FIR emission of NGC 891 (Popescu et al. 2000b). |
|
At 170 and 200 µm the model for NGC 891 predicts that the bulk of the FIR dust emission is from the diffuse component. The close agreement between the data and the model predictions, both in integrated flux densities, but especially in terms of the spatial distribution, constitutes a strong evidence that the large-scale distribution of stellar emissivity and dust predicted by the model is in fact a good representation of NGC 891. In turn, this supports the prediction of the model that the dust emission in NGC 891 is predominantly powered by UV photons.
Depending on the FIR/submm wavelength, the UV-powered dust emission arises in different proportions from within the localised component (HII regions) and from the diffuse component (Fig. 13; right panel). For example at 60 µm, 61% of the FIR emission in NGC 891 was predicted to be powered by UV photons locally absorbed in star-forming complexes, 19% by diffuse UV photons in the weak radiation fields in the outer disk (where stochastic emission predominates), and 20% by diffuse optical photons in high energy densities in the inner part of the disk and bulge. At 100 µm the prediction was that there are approximately equal contributions from the diffuse UV, diffuse optical and locally absorbed UV photons. At 170, 200 µm and submm wavelengths, most of the dust emission in NGC 891 was predicted to be powered by the diffuse UV photons. The analysis described above does not support the preconception that the weakly heated cold dust (including the dust emitting near the peak of the SED sampled by the ISOPHOT measurements presented here) should be predominantly powered by optical rather than UV photons. The reason is as follows: the coldest grains are those which are in weaker radiation fields, either in the outer optically thin regions of the disk, or because they are shielded from radiation by optical depth effects. In the first situation the absorption probabilities of photons are controlled by the optical properties of the grains, so the UV photons will dominate the heating. The second situation arises for dust associated with the young stellar population, where the UV emissivity far exceeds the optical emissivity.