


ISOPHOT imaged three nearby galaxies (M 31: Haas et al. [34]; M 33: Hippelein et al. [42] and M 101: Tuffs & Gabriel [86]) in the 60 to 200 µm range, with sufficient linear resolution to easily distinguish between the main morphological components in the FIR - nucleus, spiral arms and underlying disk. The main discovery, made possible by the unprecedented surface brightness sensitivity longwards of 100 µm, was the existence of large amounts of cold dust associated both with the spiral arms and with the underlying disk. This dust was too cold to have been seen by IRAS. Furthermore, ground-based submillimeter (submm) facilities have lacked the surface brightness sensitivity to map the diffuse component of the cold dust associated with the underlying disk. Recently, however, a submillimeter counterpart of the diffuse disk known from FIR studies was revealed through deep SCUBA mapping of M 51 (Meijerink et al. [58]).
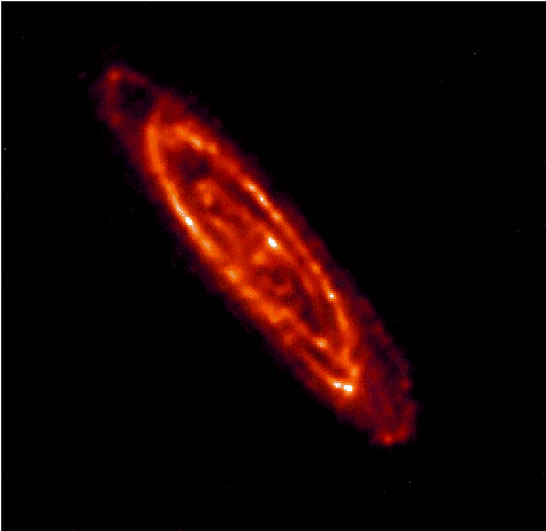
In the case of the Sab galaxy M 31, most of the emission at
170 µm arises from the underlying disk, which has a completely
diffuse appearance (Fig. 1, left panel). This
diffuse disk
emission can be traced out to a radius of 22kpc, so the galaxy has a
similar overall size in the FIR as seen in the optical bands.
Fig. 1 (left panel) also shows that at 170
µm the
spiral arm component is dominated by a ring of 10kpc radius. In
addition, there is a faint nuclear source, which is seen more
prominently in HIRES IRAS 60 µm maps at similar resolution and
in H . The overall SED
(Fig. 1, right panel) can be
well described as a superposition of two modified
(
. The overall SED
(Fig. 1, right panel) can be
well described as a superposition of two modified
( = 2) Planck
curves, with dust temperatures TD of 16 and 45K. The cold
dust component at 16K arises from both the ring structure (30%)
and the diffuse disk (70%; Haas, private communication),
illustrating the importance of the diffuse emission at least for this
example. The 45K component matches up well with HII regions within
the star-formation complexes in the ring structure. Associated with
each star-formation complex are also compact, cold emission sources
(Schmitobreick et al.
[76])
with dust
temperatures in the 15 to 20K range. These could well represent the
parent molecular clouds in the star-formation complexes which gave
rise to the HII regions. Detailed examination of the morphology of
the ring shows a smooth component of cold dust emission as well as the
discrete cold dust sources. Finally, the nuclear emission was fitted
by a 28K dust component.
= 2) Planck
curves, with dust temperatures TD of 16 and 45K. The cold
dust component at 16K arises from both the ring structure (30%)
and the diffuse disk (70%; Haas, private communication),
illustrating the importance of the diffuse emission at least for this
example. The 45K component matches up well with HII regions within
the star-formation complexes in the ring structure. Associated with
each star-formation complex are also compact, cold emission sources
(Schmitobreick et al.
[76])
with dust
temperatures in the 15 to 20K range. These could well represent the
parent molecular clouds in the star-formation complexes which gave
rise to the HII regions. Detailed examination of the morphology of
the ring shows a smooth component of cold dust emission as well as the
discrete cold dust sources. Finally, the nuclear emission was fitted
by a 28K dust component.
 |
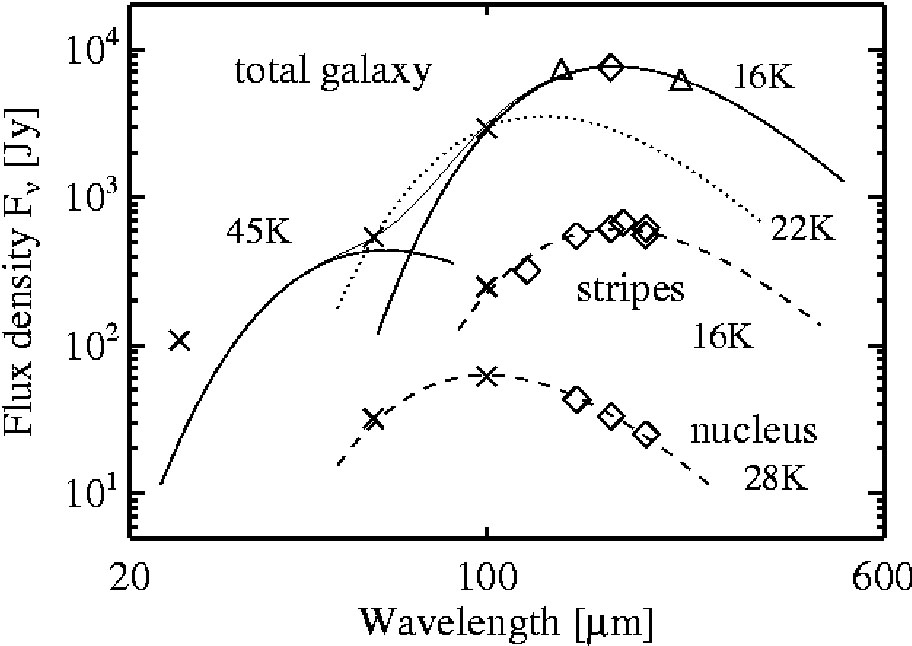 |
Figure 1. Left: ISOPHOT 170
µm map of M 31 (Haas et al.
[34]),
with an angular resolution of 1.3'. North is towards the top,
and East is towards the left. The field size is 2.9 × 2.9
degrees. Right: Infrared SED of M 31 (Haas et
al. [34]).
The data are shown by symbols (diamonds ISO, crosses IRAS,
triangles DIRBE) with the size being larger than the errors. The
blackbody curves with emissivity proportional to
|
|
The ISOPHOT maps of the Sc galaxies M 33 and M 101 show the same morphological components as seen in M 31, with the difference that the spiral arm structure can be better defined in these later-type spirals. Also the star-formation complexes in the spiral arms show similar SEDs to those seen in M 31.
In conclusion, the characteristics of the FIR emission from the main morphological components of spiral galaxies are:
 TD
60 K
from HII regions
TD
60 K
from HII regions
TD
20 K
from parent molecular clouds
TD
20 K2.1.2. The extent of spiral disks in the FIR
Further information about the distribution of dust in spiral disks is provided by FIR observations of galaxies more distant than the highly resolved local galaxies discussed in Sect. 2.1.1, but still close enough to resolve the diffuse disk at the longest FIR wavelengths accessible to ISO. In a study of eight spiral galaxies mapped by ISOPHOT at 200 µm, Alton et al. ([1]; see also Davies et al. [23] for NGC 6946) showed that the observed scalelength of FIR emission at 200 µm is greater than that found by IRAS at 60 and 100 µm. Thus, the scalelength of the FIR emission increases with increasing FIR wavelength. This result was reinforced using LWS measurements of the dust continuum by Trewhella et al. [84], and can also be inferred from Hippelein et al. [42] for M 33. This implies that the bulk of the 200 µm emission arises from grains heated by a radially decreasing radiation field, as would be expected for grains in the diffuse disk. If most of the 200 µm emission had arisen from localised sources associated with the parent molecular clouds, there should be no FIR colour gradient in the galaxy, since the SEDs of sources which are locally heated should not depend strongly on position.
The second result to come out of the studies by Alton et al. [2] and Davies et al. [23] is that the observed scalelength at 200 µm is comparable to or exceeds the scalelength of the optical emission (see also Tuffs et al. [85]). As noted by Alton et al. [2], this result implies that the intrinsic scalelength of the dust in galaxies is greater than that of the stars. This is because the apparent scalelength of stars should increase with increasing disk opacity (since the inner disk is expected to be more opaque than the outer disk) whereas the apparent scalelength of the dust emission will be less than the intrinsic scalelength (due to the decrease in grain temperature with increasing galactocentric radius). The extraction of the precise relation between the intrinsic scalelengths of stars and dust requires a self-consistent calculation of the transfer of radiation through the disk (see Popescu & Tuffs [69]). The reason for the difference between the intrinsic scalelength of stars and dust in galaxies is not self-evident, since it is the stars themselves which are thought to be the sources of interstellar grains (produced either in the winds of evolved intermediate mass stars or perhaps in supernovae). One might speculate either that there is a mechanism to transport grains from the inner disk to the outer disk, or that the typical lifetimes of grains against destruction by shocks is longer in the outer disk than it is in the inner disk.
While Alton et al. and Davies et al. showed that the scalelength of the 200 µm emission was comparable to or slightly larger than that of the optical emission, these studies did not actually detect grain emission beyond the edge of the optical disk. Since spiral galaxies in the local universe are commonly observed to be embedded in extended disks of neutral hydrogen - the so called "extended HI disks", it is a natural question to ask whether these gaseous disks contain grains. This question was answered in the affirmative by Popescu & Tuffs [68], through dedicated deep FIR maps of a large field encompassing the entire HI disk of the edge-on spiral galaxy NGC 891, made using ISOPHOT at 170 and 200 µm (see Fig. 2.).
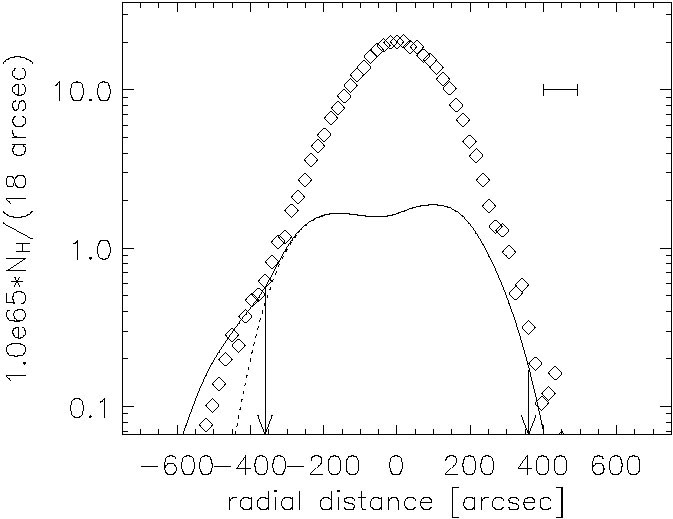 |
Figure 2. The radial profiles of HI emission (from Swaters et al. [83]) convolved with the ISOPHOT PSF (solid line) and of 200 µm FIR emission (symbols) of NGC 891 (Popescu & Tuffs [68]). Note that the extent and asymmetry of the 200 µm emission follow that of the HI emission. The profiles are sampled at intervals of 18". The negative radii correspond to the southern side of the galaxy and the galaxy was scanned at 60 degrees with respect to the major axis. The units of the FIR profile are W/Hz/pixel, multiplied by a factor of 2 × 10-22 and the error bars are smaller than the symbols. The horizontal bar delineates the FWHM of the ISOPHOT PSF of 93". The vertical arrows indicate the maximum extent of the optically emitting disk. The dotted line represents a modified HI profile obtained in the southern side from the original one by cutting off its emission at the edge of the optical disk and by convolving it with the ISOPHOT PSF. |
The large amounts of grains found in the extended HI disk of NGC 891 (gas-to-dust ratio of ~ 1%) clearly shows that this gaseous disk is not primordial, left over from the epoch of galaxy formation. It was suggested that the detected grains could have either been transported from the optical disk (via the halo, using mechanisms such as those proposed by Ferrara [29], Davies et al. [22], Popescu et al. [70] or through the action of macro turbulence) or that they could have been produced outside the galaxy (for example transferred in interactions with other galaxies). It is interesting to note that, although the dust emission is seen towards the HI component, the grains may not actually be embedded in the neutral ISM. Instead, this dust could trace an "unseen" molecular component, as proposed by Pfenniger & Combes [63], Pfenniger, Combes & Martinet [64], Gerhard & Silk [31], and Valentijn et al. [92]. This cold molecular gas component has been invoked as a dark matter component to explain the flat rotation curves of spiral galaxies. Its presence might also reconcile the apparent discrepancy between the very low metallicities measured in HII regions in the outer disk (Ferguson, Gallagher & Wyse [28]) and the high ratio of dust to gas (on the assumption that all gas is in form of HI) found by Popescu & Tuffs [68] in the extended HI disk of NGC 891.
2.1.3. Comparison with morphologies at other wavelengths
Comparison with H
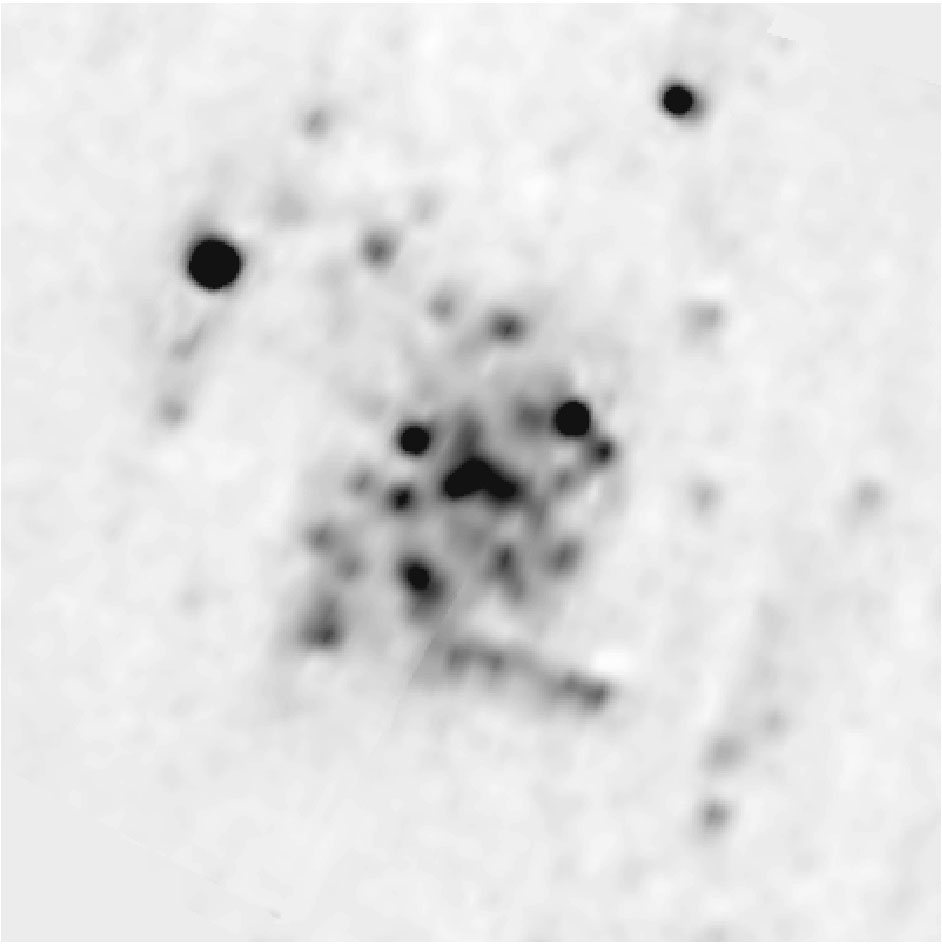
For the highly resolved galaxy M 33, Hippelein et al.
[42] showed
that there is a strong resemblance between the morphology of the
localised warm dust component at 60 µm
(Fl60; obtained at
each direction by subtracting the 170 µm map scaled by the
ratio of the
60 / 170 µm brightness in the interarm regions) and
the morphology of the
H emission (see
Fig. 3),
indicating that the 60 µm localised emission traces the
star-formation complexes. The
FH / Fl60 ratio (see
Fig. 4) for the star-formation complexes shows a
clear
systematic increase with increasing radial distance from the centre
(allowing for the [NII] line contribution decreasing with distance,
the slope would be even steeper). Very probably this is due to the presence
of a larger scale gradient of opacity affecting the recombination line
fluxes.
 |
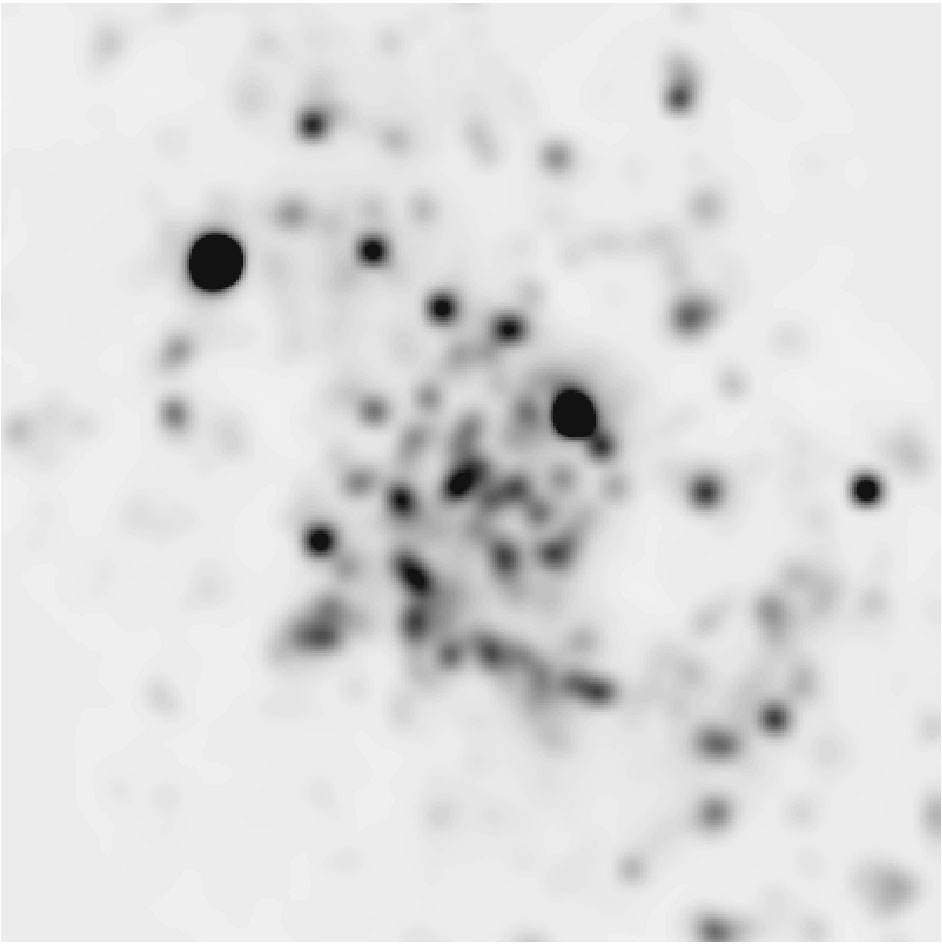 |
Figure 3. Left: Distribution of the
localised warm dust component at
60 µm, Fl60, in M 33 (Hippelein et al.
[42]).
This is the scaled difference map
2(F60 -0.165 × F160), with the
factor 0.165 given by the average flux density ratio
F60 / F170 in the interarm
regions. Right: H |
|
 |
Figure 4. The ratio of
FH |
Comparison with UV
A fundamental property of spiral galaxies is the fraction of light from young stars which is re-radiated by dust. This property can be investigated as a function of position in the galaxy by a direct comparison of ISOPHOT maps at 60, 100 and 170 µm with UV maps obtained with GALEX (Galaxy Evolution Explorer; Martin et al. [56]) in its near-UV (NUV; 2310Å) and far-UV (FUV; 1530Å) bands. Such a comparison was performed for M 101 by Popescu et al. [72]. The top panels in Fig. 5 display the 100 µm ISOPHOT image (left) together with the corresponding "total UV" (integrated from 1412 to 2718Å) image (right). Comparison between the ratio image (100 µm/UV) (bottom left panel) and an image of the "spiral arm fraction" (the fraction of the UV emission from the spiral arm within an ISOPHOT beam; bottom right panel) shows that the high values of the 100 µm/UV ratio trace the interarm regions. In other words the "spiral features" in the ratio image are in reality regions of diffuse emission which are interspaced with the real spiral features, as seen in the "spiral arm fraction" image.
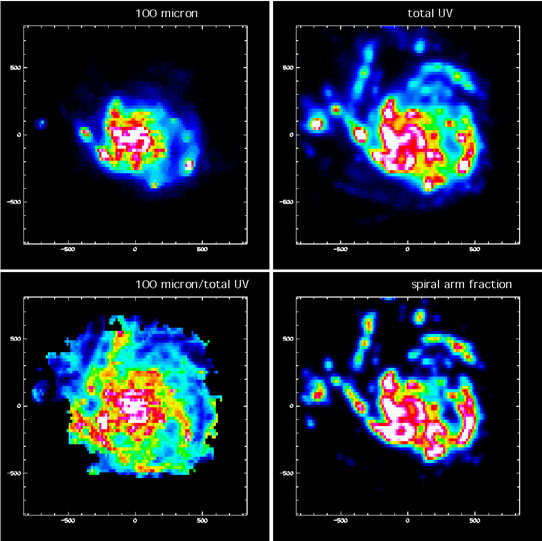 |
Figure 5. FIR-UV comparison for M 101
(Popescu et al.
[72]).
Top left: filter-integrated 100 µm ISOPHOT image. Top
right: "total UV" image. Bottom left: ratio of the filter-integrated
100 µm ISOPHOT image
divided by the corresponding "total UV" image. Bottom right:
the "spiral arm fraction". All panels depict a field of 27.7' ×
27.1' centered at
|
The trend for the FIR/UV ratio to be higher in the diffuse interarm regions than in the spiral-arms is seen in Fig. 6 from the segregation of the blue dots and red diamonds at a given radius. This apparently surprising result was explained in terms of the escape probability of UV photons from spiral arms and their subsequent scattering in the interarm regions, and in terms of the larger relative contribution of optical photons to the heating of the dust in the interarm regions. The combined effect of the optical heating and the scattering of the UV emission means that the FIR/UV ratio will not be a good indicator of extinction in the interarm region.
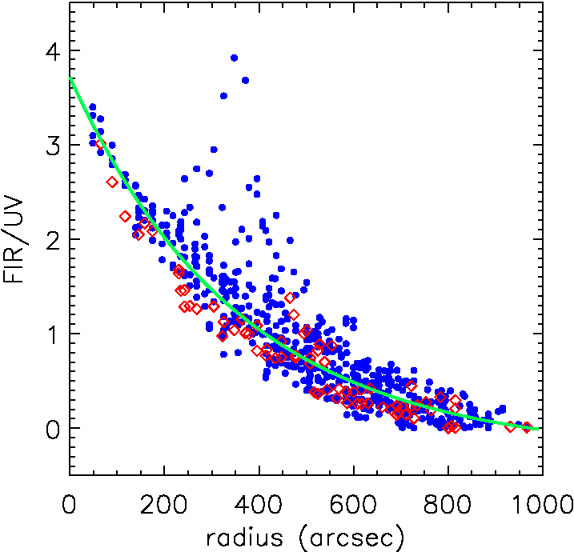 |
Figure 6. The pixel values of the FIR/UV ratio map of M 101 (Popescu et al. [72]) at the resolution of the 170 µm image versus angular radius. The blue dots are for lines of sight towards interarm regions and the red diamonds towards the spiral arm regions. The green solid line is an offset exponential fit to the data. |
Despite these local variations, the main result of Popescu et al. [72] is the discovery of a tight dependence of the FIR/UV ratio on radius, with values monotonically decreasing from ~ 4 in the nuclear region to nearly zero towards the edge of the optical disk (see Fig. 6). This was interpreted in terms of the presence of a large-scale distribution of diffuse dust having a face-on optical depth which decreases with radius and which dominates over the more localised variations in opacity between the arm and interarm regions.
 -2 are
shown by lines. The dotted line with T = 22K through the IRAS 60 and
100 µm data points indicates what one would extrapolate from
this wavelength range alone without any further assumptions.
-2 are
shown by lines. The dotted line with T = 22K through the IRAS 60 and
100 µm data points indicates what one would extrapolate from
this wavelength range alone without any further assumptions. 2000 =
54°21'06.6", and have the
orientation, resolution and sampling (15.33" × 23.00")
of the 100 µm ISOPHOT image.
2000 =
54°21'06.6", and have the
orientation, resolution and sampling (15.33" × 23.00")
of the 100 µm ISOPHOT image.