Copyright © 2006 by Annual Reviews. All rights reserved
| Annu. Rev. Astron. Astrophys. 2006. 44:
xxx-xxx Copyright © 2006 by Annual Reviews. All rights reserved |


Perhaps the best way of breaking the age-metallicity degeneracy is by looking back in time, studying galaxies at higher and higher redshifts. In the 1990s this was attempted first with 4m-class telescopes, and later, with impressive success, with 8-10m-class telescopes and HST. Studies first focused on cluster ellipticals, and their extension to field galaxies followed with some delay. Thus, the evolution with redshift of various galaxy properties were thoroughly investigated, such as the C-M and Kormendy relations, the luminosity and mass functions, and the FP. Various ongoing surveys are designed to map the evolution with redshift and local environment of all these properties, along with the number density of these galaxies.
4.1. Cluster Ellipticals Up to z ~ 1
4.1.1 THE COLOR-MAGNITUDE RELATION With the
identification of clusters at higher and higher redshifts, from the
mid-1990s it became possible to construct their C-M relation,
hence to directly assess the rate of evolution of cluster
ETGs. Pioneering studies showed a clearly recognizable red sequence
in high-redshift clusters, and gave hints that the color evolution
up to z ~ 1 was broadly consistent with pure
passive evolution of the galaxies formed at high redshift
(Dressler & Gunn
1990;
Aragón-Salamanca et
al. 1993;
Rakos & Schombert
1995).
Subsequent studies fully confirmed these early hints
and provided accurate estimates for the formation redshift of the bulk
of stars in cluster ellipticals. Thus, replicating the
Bower, Lucey & Ellis
(1992)
procedure for a sample of morphologically-selected ETGs in clusters at
z ~ 0.5,
Ellis et al. (1997)
were able to conclude that most of the star formation in ellipticals
in dense clusters was completed 5-6 Gyr earlier than the cosmic time
at which they are observed, i.e., at z
 3. Extending these
studies to clusters up to z ~ 0.9,
Stanford, Eisenhardt, and
Dickinson (1998)
showed that pure passive evolution continues all the
way to such higher redshift, while the dispersion of the C-M relation
remains as small as it is in Virgo and Coma (see
Figure 8). Thus, Stanford and colleagues
concluded that cluster ellipticals formed the bulk of
their stars at z
3, with the small
color dispersion arguing for
highly synchronized star-formation histories among galaxies within
each cluster, and from one cluster to another. These conclusions were
reinforced by several other investigators, e.g.,
Gladders et al. (1998),
Kodama et al. (1998),
Nelson et al. (2001),
De Lucia et al. (2004),
and by
van Dokkum et
al. (2000),
who also cautioned about the "progenitor bias" (see below).
3. Extending these
studies to clusters up to z ~ 0.9,
Stanford, Eisenhardt, and
Dickinson (1998)
showed that pure passive evolution continues all the
way to such higher redshift, while the dispersion of the C-M relation
remains as small as it is in Virgo and Coma (see
Figure 8). Thus, Stanford and colleagues
concluded that cluster ellipticals formed the bulk of
their stars at z
3, with the small
color dispersion arguing for
highly synchronized star-formation histories among galaxies within
each cluster, and from one cluster to another. These conclusions were
reinforced by several other investigators, e.g.,
Gladders et al. (1998),
Kodama et al. (1998),
Nelson et al. (2001),
De Lucia et al. (2004),
and by
van Dokkum et
al. (2000),
who also cautioned about the "progenitor bias" (see below).
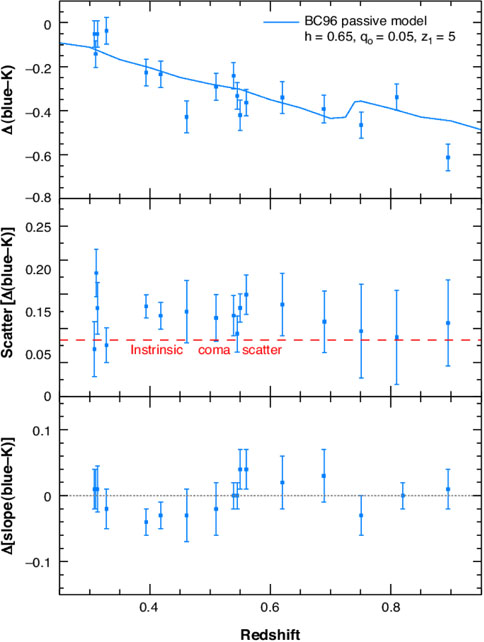 |
Figure 8. The color evolution of early-type
galaxies in clusters out to z
|
The evolution of the C-M relation was then traced beyond z = 1 thanks
to the discovery of higher redshift clusters, primarily by the Rosat
Deep Cluster Survey (RDCS,
Rosati et al. 1998).
Using deep HST/ACS (Advanced Camera for Surveys) i- and
z-band images,
Blakeslee et al. (2003)
found a tight red
sequence for morphologically selected ETGs in a z = 1.24 cluster,
implying typical ages of ~ 3 Gyr, and formation redshift
zF
3. This was
further confirmed by its infrared C-M relation
(Lidman et al. 2004).
However, some clusters in the range
0.78 < z < 1.27 appear to have a larger color scatter than
others, again with ellipticals in those with tight C-M relation having
virtually completed their star formation at z
3
(Holden et al. 2004).
Presently, the highest redshift clusters known to be
dominated by old, massive ETGs are at z
 1.4
(Stanford et al. 2005,
Mullis et al. 2005).
1.4
(Stanford et al. 2005,
Mullis et al. 2005).
The redshift evolution of the color of the red sequence in clusters
proved to be a very powerful tool in disentangling ambiguities that
are difficult to eliminate based only on z ~ 0 observations. From
the color evolution of the red sequence in two Abell clusters at
z ~ 0.2 and ~ 0.4,
Kodama & Arimoto
(1997)
were able to break the age-metallicity degeneracy plaguing most of the
global observables of local ellipticals. In principle, because colors depend
both on age and metallicity, the slope of the C-M relation could
equally well be reproduced with either age or metallicity increasing
with increasing luminosity (or
 ). However, if age were the
dominant effect, then the C-M relation would steepen with lookback
time (redshift), as the color of the young galaxies would get more
rapidly bluer compared to that of the old galaxies. Instead, the
slope of the relation remains nearly the same (see
Figure 8). Actually, the Kodama & Arimoto
argument can be applied also to
the color dispersion within a cluster, demonstrating that the
tightness of the C-M (and FP) relation in low-z clusters cannot be
due to a conspiracy of age and metallicity being anticorrelated (as
advocated e.g., by
Worthey, Trager &
Faber 1995).
If so, the color dispersion would rapidly increase with redshift,
contrary to what is seen in clusters up to z ~ 1 (see
Figure 8).
). However, if age were the
dominant effect, then the C-M relation would steepen with lookback
time (redshift), as the color of the young galaxies would get more
rapidly bluer compared to that of the old galaxies. Instead, the
slope of the relation remains nearly the same (see
Figure 8). Actually, the Kodama & Arimoto
argument can be applied also to
the color dispersion within a cluster, demonstrating that the
tightness of the C-M (and FP) relation in low-z clusters cannot be
due to a conspiracy of age and metallicity being anticorrelated (as
advocated e.g., by
Worthey, Trager &
Faber 1995).
If so, the color dispersion would rapidly increase with redshift,
contrary to what is seen in clusters up to z ~ 1 (see
Figure 8).
4.1.2 THE LUMINOSITY FUNCTION A cross check of the high formation redshift of ETGs can be provided by looking at their luminosity in distant clusters. If ETGs evolve passively, following a pure luminosity evolution, then their luminosities should increase with increasing redshift by an amount that depends on the formation redshift and on the slope of the IMF.
Initial attempts to detect the expected brightening of the
characteristic luminosity (M*) of the
luminosity function (LF) were inconclusive, as
Barger et al. (1998)
failed to detect any appreciable
change between clusters at z = 0.31 and z = 0.56, possibly
owing to the small redshift baseline. On the other hand, comparing the
LF of z ~ 0 clusters to the LF of a sample of 8 clusters at
0.40 < z < 0.48
Barrientos & Lilly
(2003)
found a brightening of the
characteristic luminosity M* consistent with
passive evolution and high formation redshift, also in agreement with
the (U - V) color
evolution of the red sequence. In a major cluster survey,
De Propris et al. (1999)
explored the evolution of the observed K-band LF in 38
clusters with 0.1 < z < 1, and compared the results to the
Coma LF. With this much larger redshift baseline, De
Propris et al. found
the trend of K* with redshift to be
consistent with passive evolution and zF
2. They pointed
out the agreement with the
results based on the color evolution of the red sequence galaxies, but
emphasized that this behavior of the LF implies that "not only their
stellar population formed at high redshift, but that the assembly of
the galaxies themselves was largely complete by z ~ 1".
Kodama & Bower
(2003) and
Toft, Soucail, &
Hjorth (2003)
came to the same
conclusions by studying the K-band LF of (respectively two and one)
clusters at z ~ 1. Breaking the z = 1 barrier,
Toft et al. (2004)
constructed a very deep K-band LF of a rich RDCS cluster at
z = 1.237, and concluded that the most massive ellipticals that
dominate the top end of the LF were already in place in this
cluster. They compared the cluster K-band LF (corresponding to the
rest-frame z-band LF) to the z-band LF of local clusters
(Popesso et al. 2005)
and derived a brightening by ~ 1.4 mag in the
rest-frame z-band characteristic magnitude, indeed as expected from
pure passive evolution. Toft and colleagues also found a substantial
deficit of fainter ETGs, which could be seen as a manifestation of the
down-sizing effect in a high redshift cluster, a hint of which was
also noticed in other clusters at z ~ 0.8
(De Lucia et al. 2004).
However, a more complete study of 3 rich clusters at 1.1
 z
1.3, including the z = 1.237 cluster studied by
Toft et al. (2004),
did not produce evidence of a down-sizing effect, down to at least 4
magnitudes below K*
(Strazzullo et
al. 2006).
This study confirmed the brightening of
Mz* and
MK* by ~ 1.3 mag,
consistent with passive evolution of a population that formed at
z 2, and
showed that the massive galaxies were already fully assembled
at z ~ 1.2, at least in the central regions of the 3 clusters.
z
1.3, including the z = 1.237 cluster studied by
Toft et al. (2004),
did not produce evidence of a down-sizing effect, down to at least 4
magnitudes below K*
(Strazzullo et
al. 2006).
This study confirmed the brightening of
Mz* and
MK* by ~ 1.3 mag,
consistent with passive evolution of a population that formed at
z 2, and
showed that the massive galaxies were already fully assembled
at z ~ 1.2, at least in the central regions of the 3 clusters.
4.1.3 THE KORMENDY RELATION
An alternative way of detecting the expected brightening of old
stellar populations at high redshift is by tracing the evolution of
the Kormendy relation, which became relatively easy only after the
full image quality of HST was restored. Thus, from HST data, the ETGs in
a cluster at z = 0.41 were found brighter by
 MK = 0.36 ± 0.14 mag
(Pahre, Djorgovski, &
de Carvalho 1996)
or by 0.64 ± 0.3 mag
(Barrientos, Schade, &
Lopez-Cruz 1996)
with respect to local galaxies, consistent (within such large errors) with
passive evolution of an old, single-burst stellar population.
Schade et al. (1996)
using excellent-seeing CFHT (Canada-France-Hawaii Telescope)
imaging data for 3 clusters
at z = 0.23, 0.43 and 0.55 detected a progressive brightening in
galaxy luminosity at a fixed effective radius that once more was
estimated to be consistent with passive evolution and formation at
high redshift. No differential evolution with respect to ETGs in the
cluster surrounding fields was detected.
MK = 0.36 ± 0.14 mag
(Pahre, Djorgovski, &
de Carvalho 1996)
or by 0.64 ± 0.3 mag
(Barrientos, Schade, &
Lopez-Cruz 1996)
with respect to local galaxies, consistent (within such large errors) with
passive evolution of an old, single-burst stellar population.
Schade et al. (1996)
using excellent-seeing CFHT (Canada-France-Hawaii Telescope)
imaging data for 3 clusters
at z = 0.23, 0.43 and 0.55 detected a progressive brightening in
galaxy luminosity at a fixed effective radius that once more was
estimated to be consistent with passive evolution and formation at
high redshift. No differential evolution with respect to ETGs in the
cluster surrounding fields was detected.
Turning to HST data, a systematic brightening in the Kormendy relation, again consistent with passive evolution and high formation redshift, was found by several other groups, eventually reaching redshifts ~ 1 (see Schade, Barrientos, & Lopez-Cruz 1997, Barger et al. 1999, Ziegler et al. 1999, Holden et al. 2005a, Pasquali et al. 2006).
4.1.4 THE FUNDAMENTAL PLANE Besides the high spatial
resolution, constructing the FP of high redshift
cluster (and field) galaxies requires moderately high-resolution
spectroscopy (to get ),
hence a telescope
with large collective area. With one exception, for a few years this
was monopolized by the Keck Telescope, and FP studies of high-z
ellipticals first flourished at this observatory. In a crescendo
toward higher and higher redshifts, the FP was constructed for
clusters at z = 0.39
(van Dokkum & Franx
1996),
z = 0.58
(Kelson et al. 1997),
z = 0.83
(van Dokkum et al. 1998,
Wuyts et al. 2004),
and finally at z = 1.25 and 1.27
(Holden et al. 2005b,
van Dokkum & Stanford
2003).
The early exception was the heroic study of two clusters at z =
0.375 using the 4m-class telescopes at ESO (NTT) and Calar Alto
(Bender, Saglia, &
Ziegler 1996,
Bender, Ziegler, &
Bruzual 1996,
Bender et al. 1998).
The redshift evolution of the FP depends on a variety of factors. For
passive evolution the FP shifts by amounts that depend on a
combination of IMF slope, formation redshift, and cosmological
parameters. A systematic trend of the IMF slope with galaxy mass
would cause the FP to rotate with increasing redshift
(Renzini & Ciotti
1993),
as it would do for a similar trend in galaxy age.
An age dispersion (
t) would cause the scatter
perpendicular to the FP to increase with redshift, as, for fixed
t,
t / t
increases for increasing redshift, i.e. decreasing galaxy age (t).
Clearly, the behavior of the FP with redshift can give a wealth of
precious information on the formation of ellipticals, their stellar
populations, and to some extent on cosmology also
(Bender et al. 1998).
All the quoted FP studies of high-z clusters conclude that the FP
actually shifts nearly parallel to itself by an amount that increases with
redshift and is consistent with the passive evolution of stellar
populations that formed at high redshifts. The FP shifts imply a
decrease of the rest-frame M / L ratio
log M /
LB
-0.46z
(van Dokkum & Stanford
2003),
but - as emphasized above -
the formation redshift one can derive from it depends on both
cosmology and the IMF. Figure 9 illustrates the
dependence on the adopted cosmology. Note that for the "old standard"
cosmology
( M = 1)
galaxies would be older than the universe and therefore the observed FP
evolution can effectively rule out this option (see also
Bender et al. 1998).
M = 1)
galaxies would be older than the universe and therefore the observed FP
evolution can effectively rule out this option (see also
Bender et al. 1998).
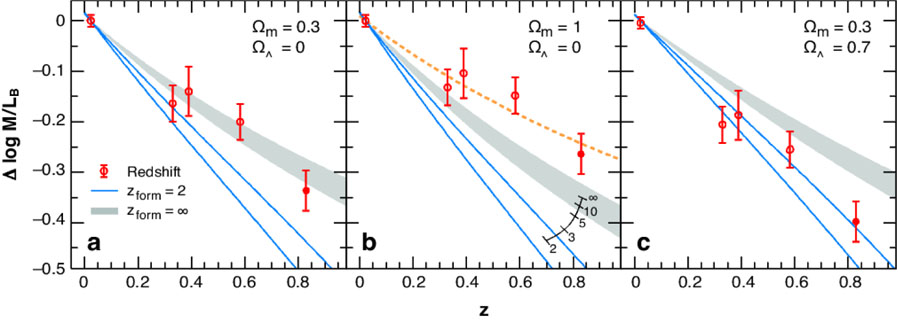 |
Figure 9. The data points show the redshift evolution of the M / LB ratio of cluster elliptical galaxies as inferred from the shifts of the fundamental plane. The lines refer to the evolution of the M / LB ratio for stellar populations with a Salpeter initial mass function (IMF) (s = 2.35) and formation redshifts as indicated in the left -and middle- panel. The comparison is made for three different cosmologies. The dotted line in the middle panel shows a model with zF=∞ and a steep IMF (s = 3.35). From van Dokkum et al. 1998). |
Figure 10 shows the effect of the IMF slope and
formation redshift on the expected evolution of the M /
LB ratio. The redshift range z = 0
to 1.5 only probes the IMF between ~ 1 and ~ 1.4
M ,
which correspond to the masses at the main sequence turnoff
MTO of oldest populations at z = 0 (age ~ 13
Gyr, MTO
M) and of
those at z = 1.5 (age ~ 4.5 Gyr and MTO
1.4
M).
Together, Figure 9 and 10
illustrate the formation
redshift/IMF/cosmology degeneracies in the FP diagnostics. However,
the cosmological parameters are now fixed by other observational
evidences, whereas the formation redshift as determined by the color
evolution of the cluster red sequence is independent of the IMF slope.
In summary, in the frame of the current concordance cosmology,
when combining the color and FP evolution of cluster ellipticals one
can conclude that the best evidence indicates a formation redshift
zF ~ 3 and a Salpeter IMF slope in the pertinent
stellar mass range (1 < M < 1.4
M).
,
which correspond to the masses at the main sequence turnoff
MTO of oldest populations at z = 0 (age ~ 13
Gyr, MTO
M) and of
those at z = 1.5 (age ~ 4.5 Gyr and MTO
1.4
M).
Together, Figure 9 and 10
illustrate the formation
redshift/IMF/cosmology degeneracies in the FP diagnostics. However,
the cosmological parameters are now fixed by other observational
evidences, whereas the formation redshift as determined by the color
evolution of the cluster red sequence is independent of the IMF slope.
In summary, in the frame of the current concordance cosmology,
when combining the color and FP evolution of cluster ellipticals one
can conclude that the best evidence indicates a formation redshift
zF ~ 3 and a Salpeter IMF slope in the pertinent
stellar mass range (1 < M < 1.4
M).
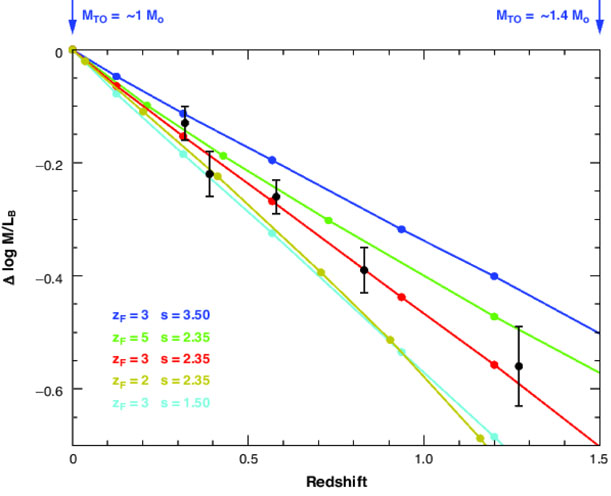 |
Figure 10. The evolution with redshift of
the M* / LB ratio of
simple stellar populations of solar metallicity and various initial
mass function slopes (dN
|
The fact that the cluster FP does not appreciably rotate with increasing
redshift is documented down to
~ 100 km s-1
for clusters out to z ~ 0.3-0.4 (lookback time ~ 4 Gyr)
(Kelson et al. 2000,
van Dokkum & Franx
1996)
and down to ~ 150 km
s-1 out to z ~ 0.8 (lookback time ~ 7 Gyr)
(Wuyts et al. 2004).
If the large age trends with
derived in some of the
studies using the Lick/IDS indices were real (see
Section 3.1), this would result in
a very large rotation of the FP in these clusters. For example, if age
were to increase along the FP from 5.5 Gyr to 13 Gyr (at z = 0,
and for = 100 and 320 km
s-1, respectively, see
Nelan et al. 2005),
then at a lookback time of 4 Gyr (z ~ 0.4) the younger population
would have brightened by
MB ~
1.33 mag, and the older one only by ~ 0.46 mag (using models from
Maraston 2005),
which results in a FP rotation of ~ 0.9 mag in surface brightness.
Alternatively, the much shallower
age- relation derived by
Thomas et al. (2005)
implies an age increase from ~ 9.5 Gyr to ~ 11.5
Gyr for increasing from
180 to 350 km s-1, which implies a
rotation of the FP by ~ 0.36 mag in surface brightness by
z = 0.8, which is still consistent with the hint that in fact
there may be a small FP rotation in a cluster at this redshift
(Wuyts et al. 2004).
The scatter about the FP of clusters also remains virtually unchanged with increasing redshift, however some of the claimed age-metallicity anticorrelations derived from the Lick/IDS indices would result in a dramatic increase of the scatter with redshift, causing the FP itself to rapidly blur away.
4.1.5 THE LINE INDICES
The intermediate resolution spectra used for constructing the FP of
distant cluster ETGs, were also used to measure age-sensitive line
indices that can provide further constraints on the formation
epoch. Thus,
Bender, Ziegler, &
Bruzual (1996)
and Ziegler & Bender
(1997)
measured the Mgb index of 16 ETGs in their two clusters at
z = 0.375, and found that the Mgb -
relation was shifted
toward lower values of the index. From such differences in Mgb
index, Ziegler & Bender inferred that the age of the z = 0.375
galaxies is about two thirds of that of ETGs in Coma and
Virgo. Therefore, t(z = 0) -
tF = 1.5
× [t(z = 0.375) - tF], where t
is the cosmic time and tF the cosmic time when the
local and distant cluster ETGs formed (which is assumed to be the
same). Adopting the t - z relation for the concordance
cosmology, one derives tF ~ 1.7 Gyr, corresponding to
zF
3.
From the strength of the Balmer absorption lines
(H and
H
and
H )
as age indicators,
Kelson et al. (2001)
used data for several clusters up to z = 0.83 and were able to
set a lower limit to the formation redshift zF
2.5, consistent
with the above result from the Mgb index.
)
as age indicators,
Kelson et al. (2001)
used data for several clusters up to z = 0.83 and were able to
set a lower limit to the formation redshift zF
2.5, consistent
with the above result from the Mgb index.
In summary, the study of the stellar populations in ETGs belonging to distant clusters up to z ~ 1.3 have unambiguously shown that these objects have evolved passively from at least z ~ 2-3. This came from the color, line strength, and luminosity evolution. Moreover, the brightest cluster members at z ~ 1-1.3 and the characteristic luminosity of the LF appear to be brighter than their local counterpart by an amount that is fully consistent with pure passive evolution, indicating that these galaxies were already fully assembled at this high redshift. This may not have been the case for less massive galaxies, as their counts may be affected by incompleteness.
4.1.6 CAVEATS
Although it is well established that ETGs in
distant clusters are progenitors to their local analogs and formed at
high redshift, some caveats are nevertheless in order. First, as
frequently emphasized, the evidence summarized above only proves that
at least some cluster galaxies evolved passively from z
1
to the present, but other local ETGs may have z ~ 1 progenitors
that would not qualify as ETGs at that redshift, either
morphologically or photometrically. This "progenitor bias" (e.g.,
van Dokkum & Franx
1996)
would therefore
prevent us from identifying all the z ~ 1 progenitors of
local cluster ETGs, some of which may well be still star
forming. Second, the slope of the FP is progressively less accurately
constrained in higher and higher redshift clusters, because the
central velocity dispersion has been measured only for very few
cluster members (generally the brightest ones). Third, it is always
worth recalling that all luminosity-weighted ages tend to be biased
toward lower values by even minor late episodes of star formation.
Last, stellar population dating alone only shows when stars were formed,
not when the galaxy itself was assembled and reached its observed mass.
4.2. Field versus Cluster Ellipticals up to z ~ 1
In the local universe field ellipticals show small, yet
detectable differences compared to their cluster counterpart, being
possibly ~ 1 Gyr younger, on average. This
t difference,
if real, should magnify in relative terms and become more readily
apparent when moving to high redshift
( t /
t is increasing).
Using the color evolution of the red sequence and the shift of the FP
with redshift, progress in investigating high-z ETGs in the field
has been dramatic in recent years, along with the cluster versus field
comparison.
Schade et al. (1999)
selected ETGs by morphology from the Canada-France Redshift Survey (CFRS,
Lilly et al. 1995a,
b)
and Low Dispersion Survey Spectrograph (LDSS) redshift survey
(Ellis et al. 1996),
and constructed the rest-frame (U - V) C-M relation for
field ETGs in the 0.2 < z < 1.0 range. They found that the
C-M relation becomes progressively bluer with redshift, with
(U - V)
-0.68 ± 0.11 at z = 0.92 with respect to the relation in Coma,
accompanied by a brightening by ~ 1 mag in the rest-frame B
band, as derived from the Kormendy relation. To be consistent with the
color evolution, this brightening should have been much larger than
observed if the color evolution were due entirely to the passive
evolution of stellar populations formed at high z. Thus, Schade and
colleagues reconciled color and luminosity evolution by invoking a
residual amount of star formation (adding only ~ 2.5% of the
stellar mass from z = 1 to the present), yet enough to produce the
observed fast color evolution. Support for such an interpretation
comes from about one third of the galaxies exhibiting weak [OII] emission,
which indicates that low-level star formation is indeed fairly widespread.
The rate of luminosity evolution was found to be identical to that of
cluster ellipticals at the same redshifts, hence no major
environmental effect was detected besides the mentioned low level of
star formation and a color dispersion slightly broader than in
clusters at the same redshift.
With COMBO-17, the major imaging survey project undertaken with the
ESO/MPG 2.2m telescope,
Wolf et al. (2003)
secured deep optical imaging in 17 broad and intermediate bands over a
total 0.78 square degree area, from which
Bell et al. (2004b)
derived photometric redshifts accurate to within
z ~ 0.03. The
bimodality of the C-M relation, so evident at z ~ 0 (e.g.,
Baldry et al. 2004),
clearly persists all the way to z ~ 1.1 in the COMBO-17 data, and
this allowed Bell and colleagues to isolate ~ 5,000 "red sequence" ETGs
down to R < 24. As mentioned above, ~ 85% of such
color-selected galaxies appear also morphologically early-type on the
ACS images of the GEMS (Galaxy Evolution from Morphology and SED) survey
(Rix et al. 2004,
Bell et al. 2004a).
The rest-frame (U - V) color of ETGs in the COMBO-17
survey evolves by a much smaller amount than that reported by
Schade et al. (1999)
for the morphologically-selected ETGs, i.e., by only ~ 0.4 mag
between z = 0 and 1, as expected for an old stellar population
that formed at high redshift (zF
2). This color
evolution is also in agreement with the ~ 1.3 mag brightening of the
characteristic luminosity MB* in
the Schechter fit to the observed LF. Thus, when comparing only the
color and MB*
evolution, the field ETGs in the COMBO-17 sample seem to evolve in
much the same fashion as their cluster counterparts. Using COMBO-17
data and GEMS HST/ACS imaging,
McIntosh et al. (2005)
studied a sample of 728 morphology- and color-selected ETGs, finding
that up to z ~ 1 the Kormendy relation evolves in a manner that
is consistent with the pure passive evolution of ancient stellar
populations.
From deep Subaru/Suprime-Cam imaging over a 1.2 deg2 field
[covered by the Subaru-XMM Deep Survey (SXDS)],
Kodama et al. (2004)
selected ETGs for having the R - z and i - z
colors in a narrow range as
expected for passively evolving galaxies in the range 0.9
z
1.1, and the sampled population included both field and cluster
ETGs. They found a deficit of red galaxies in the C-M sequence ~
2 mag fainter than the characteristic magnitude (corresponding
to stellar masses below ~ 1010
M). Less
massive galaxies appear to be still actively star-forming, while above ~
8 × 10¹⁰
M
galaxies are predominantly passively evolving. This was
interpreted as evidence for down-sizing in galaxy formation (à la
Cowie et al. 1996),
with massive galaxies having experienced most of
their star formation at early times and being passive by z ~ 1,
and many among the less massive galaxies experience extended star
formation histories.
In a comprehensive study also based on deep, wide-field imaging with the Suprime-Cam at the Subaru Telescope, Tanaka et al. (2005) obtained photometric redshifts based on four or five optical bands and constructed the C-M relations for the two clusters (at z = 0.55 and 0.83) included in the field, and for their extended environment. Tanaka and colleagues further distinguished galaxies in the cluster environment as belonging either to recognized "groups", or otherwise to the "field". The results are shown in Figure 11, where the various plots allow one to visually explore trends with redshift for given environment, or with environment for given redshift. The red sequence appears already in place in the "field" in the highest redshift sample, but no clear color bimodality is apparent. (Note that COMBO-17 does find bimodality at this redshift, possibly due to its photometric redshifts based on many more bands being more accurate.) The color bimodality is instead clearly recognizable in the z = 0.55 "field" sample. At higher environmental densities (labelled "group") the C-M relation of the red sequence is clearly recognizable already in the z = 0.83 sample, and even more so in the "cluster" sample. Tanaka and colleagues argue that the bright and the faint ends of the red sequence are populated at a different pace in all three environments; the more massive red galaxies are assembled first, i.e., the C-M relation grows from the bright end to the faint end in all three environments (not in the opposite way, as one may naively expect in a hierarchical scenario), which is interpreted in terms of down-sizing. Note also that the faint end appears to be well in place in "clusters" at z = 0 while virtually still lacking in the field (see also Popesso et al. 2005). Using HST/WFPC2 imaging over a ~ 30 arcmin2 field including the same z = 0.83 cluster, Koo et al. (2005) were able to measure the rest-frame (U - B) colors of the sole bulge component of 92 galaxies with MB < -19.5, part in the cluster itself, part in the surrounding field. Their very red color does not show any environmental dependence, suggesting similarly old ages and high formation redshifts.
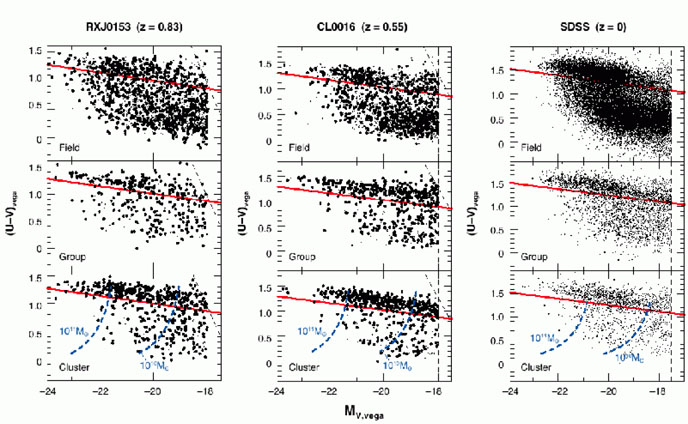 |
Figure 11. The C-M relations of two high
redshift clusters and
their surrounding fields at progressive lower density (labelled
"group" and "field") are compared to their local counterparts from
the Sloan Digital Sky Survey. The red line marks the adopted separation
between the red sequence galaxies, and the blue, star-forming
galaxies. In the cluster panels the blue dashed lines show the
approximate location of galaxies with stellar mass of 1010
(right) and 1011
M |
The public delivery of the Hubble Deep Field data (HDF, Williams et al. 1996) spurred several studies of field ETGs. Thus, Fasano et al. (1998) applied the Kormendy relation to a sample of morphologically selected ETGs in HDF-North and estimated an increase of the surface brightness at a fixed effective radius that was consistent with a high formation redshift (zF ~ 5), according to the galaxy models by Bressan, Chiosi & Fagotto (1994) and Tantalo et al. (1996).
Although the LF and the C-M and Kormendy relations had already given
useful indications on the analogies and differences between cluster
and field ETGs, major progress came with the study of the differential
evolution (field versus cluster) of the FP with redshift. In early
studies, no field/cluster difference had clearly emerged at z = 0.3
(Treu et al. 1999),
z ~ 0.4
(Treu et al. 2001),
z = 0.55
(van Dokkum et al 2001),
and z = 0.66
(Treu et al. 2002).
But already at
these modest redshifts there were hints that the brightest, most
massive ETGs in the field closely follow the FP evolution of their
cluster counterparts, while less massive ETGs (especially S0's) appear
to evolve slightly faster, and hence look younger. This was more
accurately quantified for morphologically-selected ETGs up to z ~
1 in the HDF-North by
van Dokkum & Ellis
(2003),
showing a field versus cluster difference
ln M /
LB = -0.14 ± 0.13 in the
FP. This implies that field ETGs are on average younger by only
16% ± 15% at < z> = 0.88. Van Dokkum & Ellis also
inferred that the bulk of stellar mass in the observed ETGs must have
formed at z
2 even in the field, with only minor star formation at lower
redshifts. Then, moving to the wider GOODS (Great Observatories Origin
Deep Survey)-South field
(Giavalisco et
al. 2004a),
van der Wel et al.
(2004,
2005a)
constructed the FP for a total of 33 color and
morphology-selected ETGs at 0.60 < z < 1.15, using intermediate
resolution spectra taken at the ESO Very Large Telescope (VLT). They
also found the most massive galaxies
(M* > 2 × 10¹¹
M) to
behave much like their cluster analogs at the same redshifts, while
less massive galaxies appeared to be substantially younger. Moreover,
all these studies noted the higher proportion of weak [OII] emitters
among the field ETGs (~ 20%) compared to their cluster
counterparts, as well as the higher proportion of galaxies with strong
Balmer lines (the K+A Galaxies).
The main limitations of all these early studies was in the small
number of objects observed at each redshift, which must go a long way
toward accounting for occasional discrepancies in the results. In a
major effort to overcome this limitation,
Treu et al. (2005a,
b)
obtained high-resolution spectra at the Keck telescope for 163
morphologically-selected ETGs in the GOODS-North field, which were
distributed over the redshift range 0.2 < z < 1.2. The main
results of this study are displayed in
Figure 12, showing that the most massive
ellipticals in the field do not differ appreciably from their cluster
analogs in having luminosity-weighted ages implying zF
3. However, the lower the mass the larger the dispersion in the
M / LB ratio, with a definite trend toward
lower values with
decreasing mass, implying lower and lower formation redshift. This
demonstrates that completion of star formation in field galaxies
proceeds from the most massive to the less massive ones, as is indeed
expected from the down-sizing effect
(Cowie et al. 1996,
Kodama et al. 2004)
and is consistent with the scenario shown in
Figure 6. This
systematic trend in the M / L ratio with galaxy mass
results in a "rotation" of the FP with increasing redshift, as less massive
galaxies evolve faster in luminosity compared to the more massive,
older ones (but one should beware of possible Malmquist bias). This
result confirms early hints for a modest rotation of the FP of field
ETGs with redshift, as also does a study of the FP of 15 ETGs at
0.9 z
1.3 by
di Serego Alighieri et
al. (2005),
a sample drawn from the K20 survey
(Cimatti et al. 2002b).
Figure 13 shows the FP for the combined
Treu et al. (2005b) and
di Serego Alighieri et
al. (2005)
samples of ETGs with < z> = 1.1, where the rotation
with respect to the Coma FP is apparent. Note that a similar FP
rotation in two clusters at z = 0.83 and 0.89 has been recently
unambiguously detected by
Jørgensen et
al. (2006),
having extended
the measurements below
~ 100 km s-1. Somewhat at variance
with the FP studies reported above was the Deep Groth Strip Survey
result
(Gebhardt et al. 2003),
in which no difference in the slope was
found up to z ~ 1 compared to the local FP (hence no down-sizing),
which was coupled to a much faster luminosity evolution compared to
all other results.
Treu et al. (2005b)
discuss the possible origins of
the discrepancy, and attribute it to a combination of selection bias,
small number statistics, and relatively low S/N spectra.
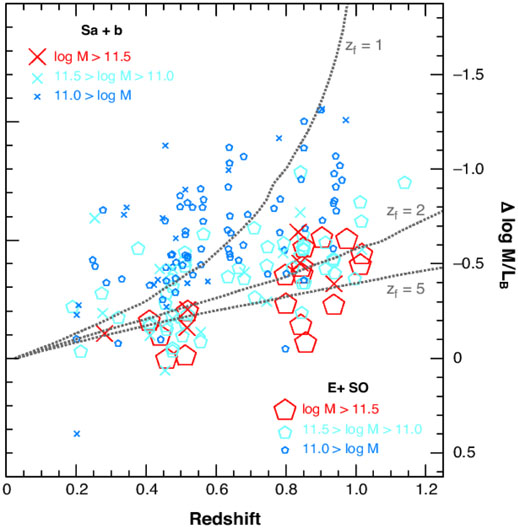 |
Figure 12. The offset
|
 |
Figure 13. An edge-on view of the
fundamental plane for field ETGs at z ~ 1.1 from
di Serego Alighieri et al.
(2005,
red squares and black circles)
and Treu et al. (2005b,
green squares). Open triangles refer to the Coma ellipticals from
Jørgensen, Franx,
& Kjærgaard (1995)
and the dashed line is a best fit to the
data. The dotted line is shifted parallel to the dashed line by an
amount in surface brightness corresponding to the observed shift of
the fundamental plane of galaxy clusters (i.e.,
|
From population synthesis models one expects the rate of evolution of
the M / L ratio to be slower at longer wavelengths
compared to the B
band, because it is less affected by the main sequence turnoff moving
to cooler temperatures with increasing age. This expectation was
qualitatively confirmed by
van der Wel et
al. (2005b),
who found
ln(M /
LB) = -(1.46 ± 0.09)z and
ln (M /
LK) = -(1.18 ± 0.1)z, which appears to be
in agreement with the prediction of some models
(Maraston 2005),
but not of others
(Bruzual & Charlot
2003),
possibly owing to the different treatment of the AGB contribution.
Instead of measuring central velocity dispersions directly,
Kochanek et
al. (2000) and
Rusing and Kochanek
(2005)
estimated them from the lens geometry for a sample of (field) lensing
ETGs at 0.2
z 1. The
resulting FP
shifts appear to be similar to those of cluster ETGs, although with more
scatter, and indicate <zF>
1.5 for the bulk
of the stars in the lensing galaxies.
In summary, like at low redshifts, also at z ~ 1 there appear to be small detectable differences between ETGs in high- and low-density regions, but such differences are more evident for faint/low-mass galaxies than for the bright ones.
4.3. Ellipticals Beyond z ~ 1.3
Up to z ~ 1.3 the strongest features in the optical spectrum of ETGs are the CaII H&K lines and the 4000 Å break. But at higher redshifts these features first become contaminated by OH atmospheric lines, and then move to the near-IR, out of reach of CCD detectors. The lack of efficient near-IR multi-object spectrographs (even in just the J band) has greatly delayed the mapping of the ETG population beyond z ~ 1.3. Thus, for almost a decade the most distant spectroscopically confirmed old spheroid was an object at z = 1.55 selected for being a radiogalaxy (Dunlop et al. 1996, Spinrad et al. 1997). The spectral features that made the identification possible included a set of FeII, MgII and MgI lines in the rest-frame near-UV, in the range of ~ 2580-2850 Å, which is typical of F-type stars. The UV Fe-Mg feature offers at once both the opportunity to measure the redshift, and to age-date the galaxy, because it appears only in populations that have been passively evolving since at least a few 108 years. It has been also used to age-date local ETGs (e.g., Buson et al. 2004). Thus, using this feature, Spinrad and colleagues inferred an age of ~ 3.5 Gyr, implying zF > 5 (even in modern cosmology).
This record for the highest redshift ETG was eventually broken by
Glazebrook et
al. (2004) and
Cimatti et al. (2004),
using the
same features in the rest-frame UV (see
Figure 14). They reported the
discovery of, respectively, five passively evolving galaxies at
1.57 z
1.85, and four
other such objects at 1.6
z
1.9. All being brighter than K = 20, these galaxies are quite
massive (M
1011
M), and
hence would rank among the most
massive galaxies even in the local universe. This suggests that they
were (almost) fully assembled already at this early epoch, and having been
passive since at least ~ 1.1 Gyr had to form
at redshift 2.7.
The four objects found by Cimatti and colleagues
are included in the GOODS-South field, and the GOODS deep HST/ACS imaging
showed that two objects are definitely elliptical galaxies, and the two
others are likely to be S0's.
 |
Figure 14. The rest-frame coadded spectrum of the four passively evolving galaxies at 1.6 < z < 1.9 with the identification of the main spectral features (blue spectrum). The spectrum from Bruzual & Charlot (2003) for a 1-Gyr-old SSP (simple stellar population) model of solar metallicity is also shown (red spectrum). (From Cimatti et al. 2004). |
Though breaking the old redshift record was certainly an exciting result, perhaps far more important was the discovery that the surface density of z > 1.5 ETGs is indeed much higher than one would have expected from just the single object found by Dunlop et al. (1996). Indeed, this galaxy was selected from a catalog of radiogalaxies covering a major fraction of the whole sky, whereas the nine galaxies in the Cimatti and colleagues and Glazebrook and colleagues samples come from a combined area of only 62 arcmin2.
Further identifications of very high redshift ETGs used this UV feature:
McCarthy et al. (2004)
reported the discovery of 20 ETGs with
1.3 z
2.15 and
K < 20 as part of the Gemini Deep Deep
Survey (GDDS) (including the 5 galaxies from
Glazebrook et al. 2004).
Within the ~ 11 arcmin2 area of the Hubble Ultra Deep
Field (HUDF, Beckwith et al. in preparation),
Daddi et al. (2005b)
identified 7 ETGs with 1.39
z
2.5 using their
HST/ACS grism
spectra. For all these objects the stellar mass derived from the
spectral energy distribution (SED, typically extending from the B to
the K band) is in excess of ~ 1011
M. Over
the same field,
Yan et al. (2004)
identify 17 objects with photometric
redshifts between 1.6 and 2.9, whose SED can be best fit by a dominant
~ 2 Gyr old stellar population, superimposed to a low level of
ongoing star formation.
Rather than digging deep into small fields,
Saracco et al. (2005)
searched for bright high-z ETGs over the ~ 160 arcmin2
field of the MUNICS survey
(Drory et al. 2001),
and selected objects with
R - K > 5.3 and K < 18.5 for spectroscopic
follow up with the
low-resolution, near-IR spectrograph on the TNG 3.5m telescope. They
identified 7 ETGs at 1.3
z
1.7, all with
mass well in excess of 1011
M.
Altogether, these are virtually all the spectroscopically confirmed
ETGs at z > 1.3 known to date. Given the long integration time
needed to get spectroscopic redshifts, it became clear that an effective
criterion was indispensable to select high-z ETG candidates. To
this end,
Daddi et al. (2004)
introduced a robust criterion based on the
B - z and z - K colors, that very
effectively selects galaxies at
1.4 z
2.5 (the
so-called BzKs), and among them separates the star forming BzKs with
BzK
 (z -
K)AB - (B - z)AB
(z -
K)AB - (B - z)AB
 -0.2, from the passive
ones, with BzK < -0.2 and (z -
K)AB > 2.5. The criterion is primarily an empirical
one, based on the spectroscopic redshifts from the K20 survey
(Cimatti et al. 2002b)
and other publicly available data sets. However, Daddi and colleagues
showed that synthetic stellar populations of the two kinds (i.e., star
forming and passive) do indeed occupy the corresponding areas in this
plot, when redshifted to 1.4 < z < 2.5. An application of
the method to a 320 arcmin2 field is shown in
Figure 15
(Kong et al. 2006).
In this latter study, it is estimated that the space density of massive
and passive BzKs (with K < 20, stellar mass
1011
M and
<z> 1.7)
is 20 ± 7% that of z = 0 ETGs within the same
mass limit. Then there appears to be a sharp drop of passive BzKs
beyond z = 2, which in part may be due to the available
B-band data being not deep enough
(Reddy et al. 2005)
-0.2, from the passive
ones, with BzK < -0.2 and (z -
K)AB > 2.5. The criterion is primarily an empirical
one, based on the spectroscopic redshifts from the K20 survey
(Cimatti et al. 2002b)
and other publicly available data sets. However, Daddi and colleagues
showed that synthetic stellar populations of the two kinds (i.e., star
forming and passive) do indeed occupy the corresponding areas in this
plot, when redshifted to 1.4 < z < 2.5. An application of
the method to a 320 arcmin2 field is shown in
Figure 15
(Kong et al. 2006).
In this latter study, it is estimated that the space density of massive
and passive BzKs (with K < 20, stellar mass
1011
M and
<z> 1.7)
is 20 ± 7% that of z = 0 ETGs within the same
mass limit. Then there appears to be a sharp drop of passive BzKs
beyond z = 2, which in part may be due to the available
B-band data being not deep enough
(Reddy et al. 2005)
 |
Figure 15. The BzK plot introduced by Daddi et al. (2004) is here shown for objects to a limiting magnitude KVega = 20 from a 320 arcmin2 field (from Kong et al. 2006). Black dots refer to galaxies at z < ~ 1.4, blue dots refer to starforming galaxies at ~ 1.4 < z < ~ 2.5, orange dots refer to passively evolving galaxies at ~ 1.4 < z < ~ 2.5. Green dots are Galactic stars in the same field and purple stars are local stellar standards. |
Further candidate ETGs with masses up to a few 1011
M have
been identified at even higher redshifts, such as six objects within
the HUDF at a (photometric) redshift > 2.8
(Chen & Marzke 2004),
where both the redshift and the old age are inferred from the observed
break between the J (F110W) and the H (F160W) band being
interpreted as
the 4000 Å break. One of these objects is undetected in the deep
GOODS optical data, but is prominent in the GOODS Spitzer/IRAC
3.5-µm images (M. Dickinson et al., in preparation). Thus
its SED shows two breaks, one between the z and the J
band, and one
between the K and the 3.5 µm IRAC band. Identifying them
respectively with the Lyman and Balmer breaks, the object would be placed at
z ~ 6.5, it would be passively evolving with zF
> 9, and would have the uncomfortably large mass of a few 1011
M
(Mobasher et al. 2005).
Lower redshift alternatives give much worse fits to
the data, whereas the use of models with strong AGB contribution
(Maraston 2005)
results in a somewhat less extreme mass and formation redshift.
4.4. Evolution of the Number Density of ETGs to z ~ 1 and Beyond
The studies illustrated so far have shown that ETGs exist up to z ~
1, both in clusters and in the field, and are dominated by old
stellar populations that formed at z
2-3. Moreover, a
handful of ETGs has also been identified (over small fields) well beyond
z ~ 1. Some of these ETGs appear to be as massive as the most
massive ETGs in the local universe, demonstrating that at least some
very massive ETGs are already fully assembled at z
1. However,
the expectation is for the number of ETGs to start dropping at some
redshift, when indeed entering into the star formation phase of these
galaxies, or when they were not fully assembled yet. Therefore, what
remained to be mapped by direct observations was the evolution with
redshift of the comoving number density of ETGs, and to do so as a
function of mass and environment while covering wide enough areas of
the sky in order to reduce the bias from cosmic variance. Only in this
way one could really overcome the so-called progenitor
bias. Because deep and wide surveys require so much telescope time,
progress has been slow. Cosmic variance may still be responsible for the
apparent discrepancies between galaxy counts from different surveys, but
occasionally the interpretation itself of the counts may be prone to
ambiguities.
One of the main results of the CFRS was that the number density of red galaxies shows very little evolution over the redshift range 0 < z < 1 (Lilly et al. 1995b). Following this study, in an attempt to map the number evolution of ETGs all the way to z ~ 1 , Kauffmann, Charlot, & White (1996) extracted 90 color-selected ETGs without [OII] emission from the CFRS redshift catalog. They used a V / Vmax test and concluded that at z = 1 only ~ 1/3 of bright ETGs had already assembled or had the colors expected for old, pure passively evolving galaxies. However, Im et al. (1996) identified ~ 360 ETGs morphologically selected on archival HST images, and also conducted the V / Vmax test using photometric redshifts, finding no appreciable number density evolution up to z ~ 1 and a brightening consistent with passive evolution. The V / Vmax test was repeated - again using the CFRS sample - by Totani & Yoshii (1998) who concluded that there was no evolution in the number density up to z ~ 0.8, and ascribed the apparent drop at z > 0.8 to a color selection bias. No evolution of the space density of morphologically-selected ETGs up to z ~ 1 was found by Schade et al. (1999) too, who used the HST imaging of the CFRS and LDSS redshift surveys.
Several attempts to trace the evolution of the number density of morphologically-selected ETGs to the highest possible redshifts were made using HDF data. In some of these studies very little, if any, change in the space density of ETGs was found up to z ~ 1 (e.g., Driver et al. 1998, Franceschini et al. 1998, Im et al. 1999), or up to even higher redshifts when combining the HDF optical data with very deep near-IR data (Benitez et al 1999, Broadhurst & Bouwens 2000). These latter authors emphasized that without deep near-IR data many high-z ETGs are bound to remain undetected, and that spectroscopic incompleteness beyond z ~ 0.8 is partly responsible for some of the previous discrepancies. Beyond z ~ 1 a drop in the space density of ETGs was detected in several studies including the HDF (Zepf 1997, Franceschini et al. 1998, Barger et al. 1999, Rodighiero, Franceschini, & Fasano 2001, Stanford et al. 2004). In particular, Stanford and colleagues applied the V / Vmax test to a sample of 34 ETGs from the HDF-North that includes deep NICMOS imaging in the H band (F160W), and concluded for a real drop at z > 1, but advocated the necessity to explore much wider fields in order to improve the statistics and cope with cosmic variance. Finally, the HDF-South optical data were complemented by ultra-deep JHK imaging at the VLT (the FIRES survey, Labbé et al. 2003, Franx et al. 2003), revealing a population of near-IR galaxies with very red colors (J - K > 2.3), called distant red galaxies (DRG), a fraction of which may be ETGs at very high redshifts (see below). Compared to HDF-North, its Southern equivalent appeared to be much richer in very red galaxies, e.g., including 7 objects with (V - H)AB > 3 and HAB < 25 while HDF-North has only one. Clearly, exploring much wider fields compared to HDF's ~ 5 arcmin2 field was imperative in order to make any significant progress.
Passive ETGs formed at very high redshift (e.g., z > 3) would
indeed have very red colors at z
1, and thus they
should be found
among the so-called extremely red objects (ERO), a class defined for
having R - K > 5 (or similar color cut), and whose
characteristics and relation to ETGs have been thoroughly reviewed by
McCarthy (2004).
Using a much shallower sample than that from the HDF, but one
that covers an area ~ 140 times wider than it,
Daddi et al. (2000)
and Firth et al. (2002)
showed that EROs are much more
abundant than previously found in smaller fields and are much more
strongly clustered than generic galaxies to the same limiting
magnitude K ~ 19. This made them likely candidates for high-z
ETGs, and assuming that ~ 70% of EROs are indeed ETGs at z > 1,
Daddi, Cimatti &
Renzini (2000)
concluded that most field ellipticals
were fully assembled by z ~ 1. However,
Cimatti et al. (2002a)
actually found that out of the 30 EROs with secure redshifts and
K < 19.2, only 50% are passively evolving objects and these are
distributed in the redshift interval 0.8
z
1.3, while the
other 50% is made by highly-reddened, actively star-forming
galaxies. Interestingly, precisely 50% among a sample of 129 EROs
with K < 20.2 have been detected at 24 µm with
Spitzer/MIPS, reinforcing the conclusion that up to one half of EROs are
likely to be passive precursors to ETGs
(Yan et al. 2004).
In fact, the fraction of passive EROs decreases to ~ 35% on a
spectroscopic complete sample to K = 20
(Cimatti et al. 2003).
Nevertheless, the number
density of passive EROs appeared to be broadly consistent with no
density evolution of ETGs up to z ~ 1, or a modest decrease.
With the COMBO-17 survey
Bell et al. (2004b)
went a long way toward
coping with cosmic variance. With their 5,000 color-selected ETGs up
to photometric redshift z ~ 1.1, Bell and colleagues were able to
construct their rest-frame B-band luminosity functions in nine
redshift bins (0.2 < z < 1.1), and derived the best fit
Schechter parameters for them using a fixed value of the faint-end slope,
 = -0.6. They found that
the characteristic luminosity
MB* brightens by ~ 1.0 mag between
z = 0.25 and 1.05,
consistent with passive evolution within the errors, and also with the
brightening expected from the FP shift
( log M /
LB = -0.46
z), which
predicts ~ 0.9 mag. At the same time, the normalization factor
= -0.6. They found that
the characteristic luminosity
MB* brightens by ~ 1.0 mag between
z = 0.25 and 1.05,
consistent with passive evolution within the errors, and also with the
brightening expected from the FP shift
( log M /
LB = -0.46
z), which
predicts ~ 0.9 mag. At the same time, the normalization factor
 * drops by a factor of ~ 4, but much
of the drop is in the highest redshift bins which may be affected by
incompleteness. More robust than either
* or L*
separately, is their product *
LB* which is proportional to the
B-band luminosity density, and this is found to be nearly constant
up to z ~ 0.8. This is at variance with a pure passive-evolution
scenario, that would have predicted an increase by a factor of ~
2. Thus, the color of the COMBO-17 red sequence follows nicely the
expectation from passive evolution (cf.
section 4.2), but the number
density of red sequence galaxies does not, and Bell and colleagues
concluded that the stellar mass in red sequence galaxies has nearly
doubled since z ~ 1.
* drops by a factor of ~ 4, but much
of the drop is in the highest redshift bins which may be affected by
incompleteness. More robust than either
* or L*
separately, is their product *
LB* which is proportional to the
B-band luminosity density, and this is found to be nearly constant
up to z ~ 0.8. This is at variance with a pure passive-evolution
scenario, that would have predicted an increase by a factor of ~
2. Thus, the color of the COMBO-17 red sequence follows nicely the
expectation from passive evolution (cf.
section 4.2), but the number
density of red sequence galaxies does not, and Bell and colleagues
concluded that the stellar mass in red sequence galaxies has nearly
doubled since z ~ 1.
In a major observational effort at the Keck telescope,
Faber et al. (2006,
DEEP2 project) secured spectroscopic redshifts for ~
11,000 galaxies with R < 24.1, and also reanalyzed the
COMBO-17 data,
finding separate best fit Schechter parameters in various redshift
bins up to z ~ 1.1. Faber and colleagues emphasize that
* and M*
are partly degenerate in these fits, for which the faint-end slope was
fixed at = -0.5. Thus,
between z = 0.3 and 1.1, M* brightens
by ~ 0.47 mag and * drops by a factor of ~ 2.5 for the
DEEP2 data, and respectively up by ~ 0.95 mag and down by a
factor of ~ 4 for the COMBO-17 data. Once more, much of the
*
drops are confined to the last redshift bin, and emphasis is placed on
both DEEP2 and COMBO-17 confirming that the B-band luminosity
density is nearly constant up to z ~ 0.8, along with the
implication that the mass density in ETGs has increased, presumably by
a factor of ~ 2, as estimated by
Bell et al. (2004b).
Extending the analysis from z = 0.3 to z = 0 (using SDSS
data), Faber an colleagues find
M* ~ 1.3 mag and a drop in
* by a factor of ~ 4
between z = 0 and 1.1, but caution that much of these changes occur
between the z ~ 0 survey and their first bin (at z = 0.3)
at one end, and in the last redshift bin at the other end, where the
data are said to be the weakest.
Both in COMBO-17 and DEEP2 the shape of the Schechter function for
the red-sequence galaxies is assumed constant with redshift. As such,
by construction this assumption virtually excludes down-sizing, for
which ubiquitous indications have emerged both at low as well as high
redshift. Indeed, as alluded in
Kong et al. (2006)
and documented by
Cimatti, Daddi &
Renzini (2006),
COMBO-17 and DEEP2
results can also be read in a different way.
Figure 16 shows the
evolution of the rest frame B-band LF from COMBO-17,
with the continuous line being the local LF for red-sequence galaxies
from Baldry et al. (2004).
The local LF has been shifted according to
the brightening derived from the empirical FP shift with redshift for
cluster ETGs (i.e., by MB = -1.15
z, coming from
(M /
LB) = -0.46z
(van Dokkum & Stanford
2003),
taken as the empirical template for passive evolution. From
Figure 16 it is
apparent that the brightest part of the LF is fully consistent with
pure passive evolution of the most massive galaxies, whereas the
fainter part of the LF (below ~ L*) is
progressively depopulated
with increasing redshift, an effect that only in minor part could be
attributed to incompleteness. Therefore, from these data it appears
that virtually all the most massive ETGs have already joined the red
sequence by z ~ 1, whereas less massive galaxies join it later.
This is what one would expect from the down-sizing scenario, as
exemplified e.g., in Figure 6, as if down-sizing
was not limited to
stellar ages (stars in massive galaxies are older), but it would work
for the assembly itself, with massive galaxies being the first to be
assembled to their full size. Being more directly connected to the
evolution of dark matter halos, an apparent antihierarchical assembly
of galaxies may provide a more fundamental test of the
 CDM
scenario than the mere down-sizing in star formation.
CDM
scenario than the mere down-sizing in star formation.
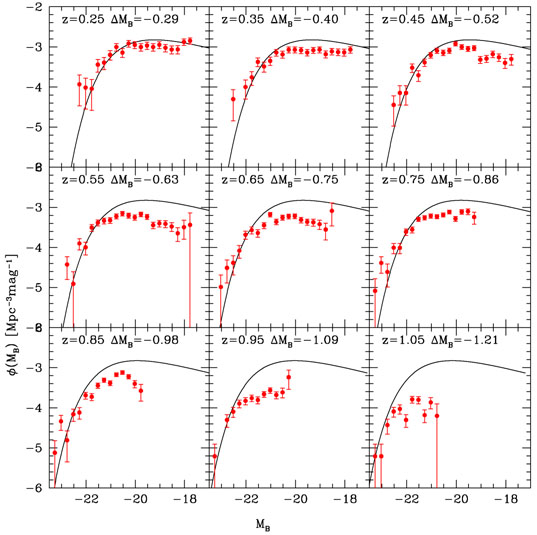 |
Figure 16. The evolution of the rest-frame
B-band luminosity
function of early-type (red sequence) galaxies from COMBO-17
(Bell et al. 2004)
is compared to to the local luminosity function (solid line) from
Baldry et al. (2004).
The local LF has been shifted in magnitude
as indicated in each panel, which corresponds to pure passive
evolution as empirically derived from the FP shift of cluster of
galaxies ( |
The slow evolution with redshift of the number density of spectrum-selected bright ETGs was also one of the main results of the K20 survey (Pozzetti et al. 2003), and more recently of the VLT VIMOS Deep Survey (VVDS) where the rest-frame B-band LF of ETGs to I < 24 is found to be broadly consistent with passive evolution up to z ~ 1, with the number density of bright ETGs decreasing by ~ 40% between z = 0.3 and 1.1 (Zucca et al. 2006).
Quite the same scenario, in which the most massive ETGs are already in place at z ~ 1 while less massive ones appear later, emerges from the study of the evolution of the stellar mass function for morphologically-selected ETGs in the GOODS fields (Bundy, Ellis & Conselice 2005, Caputi et al. 2006, Franceschini et al. 2006), and especially from the thorough re-analysis by Bundy et al. (2006) of the color-selected ETGs from the DEEP2 survey. No such effect for morphologically-selected ETGs in the GOODS-South field is mentioned in a recent study by Ferreras et al. (2005), who report instead a steep decrease in their number density with redshift. It seems fair to conclude that to fully prove (or disprove) down-sizing in mass assembly, and precisely quantify the effect, one needs to explore the luminosity and mass functions to deeper limits than reached so far, while extending the search to wider areas is needed to overcome cosmic variance. An endeavour of this size requires an unprecedented amount of observing time at virtually all major facilities, both in space and on the ground. The COSMOS project covering 2 square degrees (Scoville 2005) is deliberately targeted to this end, providing public multiwavelength data extending from X rays to radio wavelengths that will allow astronomers to map the evolution of galaxies and AGNs in their large scale structure context, and to derive photometric and spectroscopic redshifts (Lilly 2005) to substantially fainter limits than reached so far. Thus, it will be possible to directly assess the interplay between AGN activity, star-formation onset and quenching, merging, mass growth, and morphological differentiation over the largest presently possible scale, hence promising substantial, perhaps definitive progress in mapping the evolution of ETGs and their progenitors.
It is worth emphasizing that even a low-level of ongoing star formation can make galaxies drop out of our ETG samples, and that theoretical models do not make solid predictions on when star formation is going to cease in a dark matter halo. Therefore, in a broader perspective, what is perhaps more fundamental than the early-type/late-type distinction, is the stellar mass of galaxies and the evolution of the galaxy mass function, irrespective of galaxy type. Several ongoing studies are moving in this directions (e.g., Fontana et al. 2004, Drory et al. 2004, 2005, Bundy, Ellis, & Conselice 2005, Gabasch et al. 2006, Conselice, Blackburne, & Papovich 2005, etc.), but extending the discussion to the general mass assembly of galaxies goes beyond the scope of this review.
 M-s dM) and formation redshifts,
as indicated. The curves are normalized to their value at
z = 0. Concordance cosmology
(
M-s dM) and formation redshifts,
as indicated. The curves are normalized to their value at
z = 0. Concordance cosmology
( =
0.7, Ho = 70) is adopted. The data points (from
=
0.7, Ho = 70) is adopted. The data points (from