


The wealth of single dish data on the H I content of selected spirals in the cluster environment, has shown beyond doubt that H I deficiency occurs among cluster spirals. These data are less suitable to study the mechanisms that remove the gas. Projection effects along the line of sight and uncertainties about the orbital history of individual galaxies complicate matters. H I imaging has so far provided far less statistics, but in the imaging data individual galaxies can be selected that appear to have distortions in their H I morphology or kinematics that are unique to the cluster environment. A prime example is the occurrence of tiny H I disks in Virgo (Cayatte et al. 1990; Warmels 1988a, b). The size of the gaseous disks is considerably smaller than the optical disk, the effect is most pronounced close to the cluster center and gently decreases at increasing distance from the center. In addition to Virgo this has now also been seen in the Coma cluster (Bravo-Alfaro et al. 2000, 2001). Figure 3 shows an overlay of the total H I emission (contours) on an DSS optical image in greyscale. Each galaxy is located at its proper position in Coma, but the images are blown up by a factor 7. The thick contours are the X-ray emission as observed with ROSAT. The first thing to note is that the H I disks seen in projection on the X-ray emission are in general smaller compared to the optical image than for galaxies far from the center of Coma. An example in case is the galaxy CGCG 160-095 (NGC 4921) east of the center where H I is only seen in one half of the disk. This must be caused by a mechanism that only affects the gas and ram pressure stripping is a good candidate. Figure 4 shows the H I deficiency versus projected distance from the center. Its interpretation is already more complicated. Though none of the galaxies projected on to the X-ray emission has a normal H I content (deficiency 0.0), there are several non detections out to large projected radii. Possibly these galaxies have already gone through the center.
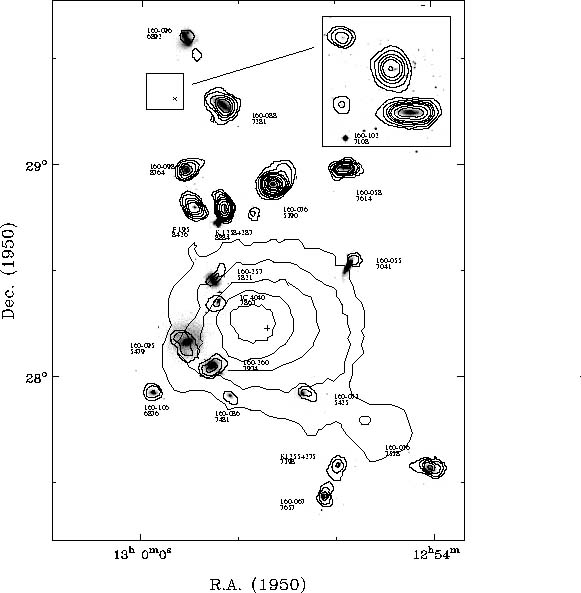 |
Figure 3. Composite of individual H I images of Coma spirals observed with the VLA. Galaxies are shown at their proper position and they are magnified by a factor 7. The H I images (contours) are overlaid on DSS optical images (greyscale). The large scale contours sketch the X-ray emission as observed by Vikhlinin et al. (1997). From Bravo-Alfaro et al. 2000. |
 |
Figure 4. Distribution of H I deficiency parameter as a function of the projected distance from the center of Coma. Filled circles correspond to H I detected galaxies and triangles to the lower limits of the deficiency parameter for the galaxies that are not detected in H I. From Bravo-Alfaro et al. 2000. |
Imaging of Virgo and Coma indicates that H I disks that are smaller than the optical ones may be generic to cluster galaxies. Numerical simulations show that this is what you expect from ram pressure stripping. Abadi et al. (1999) show the results of a simulation with a constant ram pressure typical of the Virgo Cluster ICM and galaxies moving with relative velocities of 1000 km/s for galaxies of different size. The dependence of stripping radius on disk scale length (plotted in their Figure 3) is consistent with the result found by Cayatte et al. (1994). Even more impressive is the result of Vollmer et al. (2001) shown in Figure 5. The simulation specifically models galaxies on radial orbits through the Virgo potential. The figure plots H I deficiency versus H I to optical diameter. Both the model data (stars) and observed values (Cayatte et al. 1994) are shown. The solid line corresponds to a model where only the outer parts of the disk get stripped and the constant central H I radial surface density remains unchanged in the stripping process.
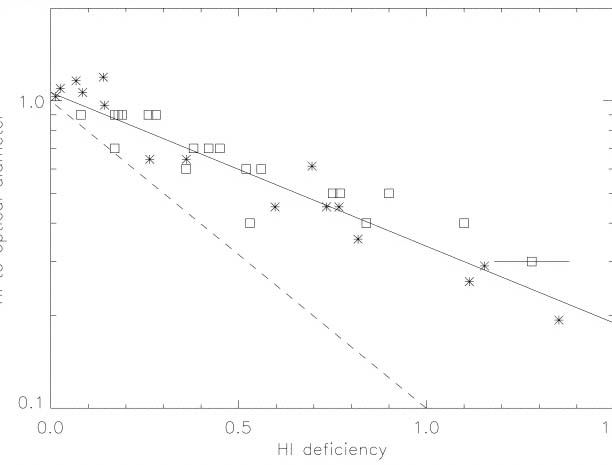 |
Figure 5. Normalized H I to optical diameter as a function of the H I deficiency for the Virgo Cluster. Squares: observed values (Cayatte et al. 1994); stars: model values. The solid line assumes that the H I surface density has the same value before and after the stripping event. From Vollmer et al. 2001. |
Vollmer in a series of papers (Vollmer 2003; Vollmer et al. 2001b; Vollmer et al. 2000; Vollmer et al. 1999) tries to reproduce observed gas distribution and kinematics of selected Virgo spirals with his N-body/sticky particle simulations. The galaxies are selected based on their H I morphology and all show truncated H I disks. This is the first time ever that both gas distribution and kinematics are put to test in comparison with models. In several cases the simulations can reproduce the observed signatures in the gas and all of these galaxies are found to be on their way out of the cluster having passed through the dense center. In one case (NGC 4654) Vollmer (2003) shows that both ram pressure stripping and a gravitational interaction must be at play.
One of the most interesting things that has been found recently is a number
of galaxies with truncated H I disks, normal or enhanced star
formation in the central regions, and some extraplanar gas on one side
of the galaxy, while the stellar disks are completely undisturbed. These
may be the best candidates for galaxies, that are currently undergoing
an ICM-ISM interaction. A prime example is NGC 4522, studied by Kenney
and collaborators in great detail.
Kenney and Koopmann
(1999)
first pointed out that NGC 4522 is one of the best candidates for ICM-ISM
stripping in action. Figures 6,
7 and 8 summarize the
main characteristics of this galaxy. NGC 4522 is located within a
subclump of the Virgo cluster centered on M49. A ROSAT map
(Figure 6) shows
weak extended X ray emission at the projected location of NGC 4522.
All the known peculiarities of NGC 4522 are associated with gas, dust
and H II regions, not with the older stars. The H I
(Figure 7) is spatially
coincident with the undisturbed stellar disk in the central 3 kpc
(0.4 R25)
of the galaxy. At 0.4 R25 the H I truncates abruptly and is
only seen above the plane to the SW. About half of the total the H I
appears to be extraplanar extending to
 3 kpc above the plane
(Kenney et al. 2003).
There is striking similarity between the spatial distribution of the
H
3 kpc above the plane
(Kenney et al. 2003).
There is striking similarity between the spatial distribution of the
H emission and the
H I emission (Figure 8). The
H emission from the disk
is confined to the inner 3 kpc as well and extraplanar
H filaments (10% of the
H
emission) emerge from the outer edge of the
H disk
(Kenney and Koopmann
1999).
Note that there are H II regions associated with each of
the 2 major extraplanar H I peaks, and that those in the SW are much
more luminous. These data strongly suggest an ICM-ISM interaction.
The undisturbed stellar disk rules out a gravitational interaction.
The truncated H I disk suggests ram pressure stripping is at work.
The extraplanar gas has almost certainly been swept out of the disk.
A detailed simulation by
Vollmer et al. 2000
suggests that the gas is falling
back after a stripping event, but this is inconsistent with the
observed kinematics
(Kenney et al. 2003).
More likely the gas is still on its way out due to ram pressure stripping
(Kenney and Koopmann
1999).
The combined characteristics such as a stripped H I disk, only central
H emission in the disk,
extraplanar gas on only one side of the
galaxy make this such a convincing candidate for an ICM-ISM interaction.
Evidence for enhanced central star formation in some other examples like
this makes this the more interesting. A central starburst would help use
up any remaining gas and a morphological transformation would be in place.
emission and the
H I emission (Figure 8). The
H emission from the disk
is confined to the inner 3 kpc as well and extraplanar
H filaments (10% of the
H
emission) emerge from the outer edge of the
H disk
(Kenney and Koopmann
1999).
Note that there are H II regions associated with each of
the 2 major extraplanar H I peaks, and that those in the SW are much
more luminous. These data strongly suggest an ICM-ISM interaction.
The undisturbed stellar disk rules out a gravitational interaction.
The truncated H I disk suggests ram pressure stripping is at work.
The extraplanar gas has almost certainly been swept out of the disk.
A detailed simulation by
Vollmer et al. 2000
suggests that the gas is falling
back after a stripping event, but this is inconsistent with the
observed kinematics
(Kenney et al. 2003).
More likely the gas is still on its way out due to ram pressure stripping
(Kenney and Koopmann
1999).
The combined characteristics such as a stripped H I disk, only central
H emission in the disk,
extraplanar gas on only one side of the
galaxy make this such a convincing candidate for an ICM-ISM interaction.
Evidence for enhanced central star formation in some other examples like
this makes this the more interesting. A central starburst would help use
up any remaining gas and a morphological transformation would be in place.
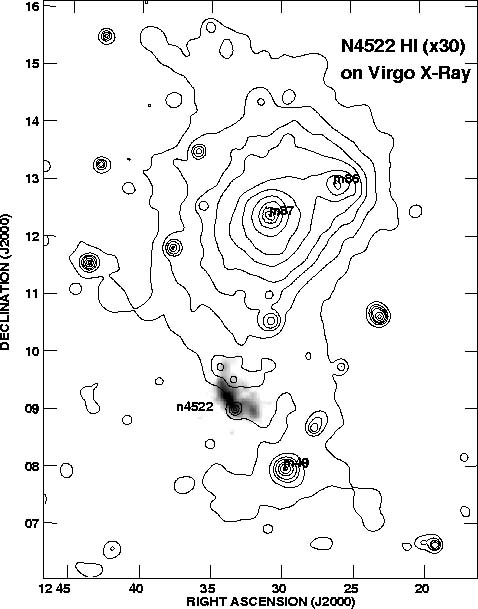 |
Figure 6. H I greyscale image of NGC 4522, scaled up in size by a factor of 30, on a ROSAT X-ray image of the Virgo cluster from Bohringer et al. (1994). The image indicates the locations of the giant ellipticals M87, M86 and M49, which are associated with sub-clusters. From Kenney et al. 2003. |
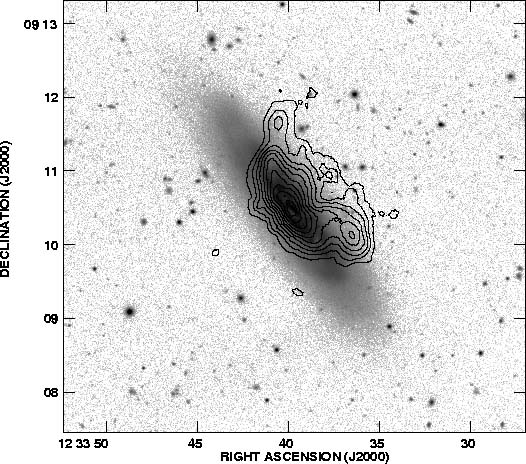 |
Figure 7. H I contours overlaid on an R band greyscale image from the WIYN telescope from Kenney & Koopmann (1999). Note the undisturbed outer disk. From Kenney et al. 2003. |
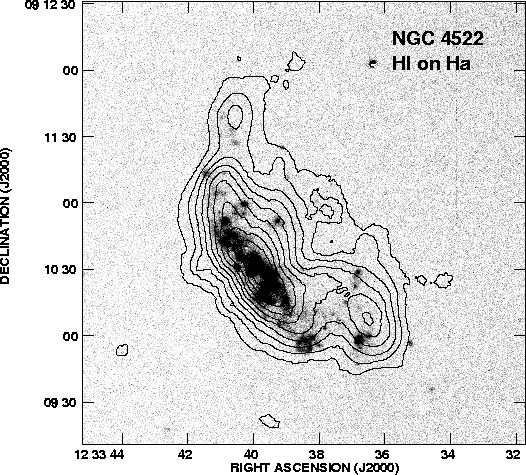 |
Figure 8. H I contours overlaid on an
H |