


Viewed edge-on, disc galaxies often have a central component which swells out of the disc and whose outline is not elliptical, but has a boxy, or peanut, or even `X' shape. Due to the morphological definition of a bulge, such components have been called bulges, or, more specifically, boxy/peanut bulges (B/Ps).
The formation of B/Ps has been witnessed in a large number of numerical simulations (Combes & Sanders (1981); Combes et al. 1990; Raha et al. 1991; Athanassoula & Misiriotis 2002, hereafter AM02; Athanassoula 2003, hereafter A03; A05; O'Neil & Dubinski 2003; Debattista et al. 2004; Martinez-Valpuesta & Shlosman 2004; Debattista et al. 2006; Martinez-Valpuesta, Shlosman & Heller 2006, etc). It is linked to the vertical instability of parts of the main family of periodic orbits constituting the bar, widely known as the x1 family (Binney 1981; Pfenniger 1984; Skokos, Patsis & Athanassoula 2002; Patsis, Skokos & Athanassoula 2002). The stability of the x1 family can be followed from the corresponding stability diagram (see e.g. figures 3 and 4 of Skokos et al. 2002) which shows that, at the positions where the x1 becomes unstable, other families bifurcate. These are linked to the n:1 vertical resonances and extend well outside the disc equatorial plane. As shown by Patsis et al. (2002), some of them are very good building blocks for the formation of peanuts, because they are stable and because their orbits have the right shape, extent and location. Studies of these orbits reproduced many of the B/P properties and helped explaining crucial aspects of B/P formation and evolution. For example, an analysis of the orbital families that constitute peanuts predicts that B/Ps should be shorter than bars. This is indeed found to be the case both in N-body simulations and in real galaxies (Lütticke, Dettmar & Pohlen 2000; A05; Athanassoula & Beaton 2006).
The time evolution of the bar, of the buckling and of the peanut strengths are plotted in Fig. 1 for a simulation which develops a strong bar. The time is given in Gyrs, using the calibration proposed in AM02. The initially unbarred disc forms a bar roughly between times 3 and 4 Gyrs (lower panel). I define as bar formation time the time at which the bar-growth is maximum (i.e. when the slope of the bar strength as a function of time is maximum) and indicate it by the first vertical line in Fig. 1. The bar strength reaches a maximum at a time indicated by the second vertical line, and then decreases considerably over ~ 1 Gyr. The time at which the bar amplitude decrease is maximum is given by the third vertical line. Subsequently, the bar strength reaches a minimum, at a time shown by the fourth vertical line, and then starts increasing again at a rate much slower than that during bar formation.
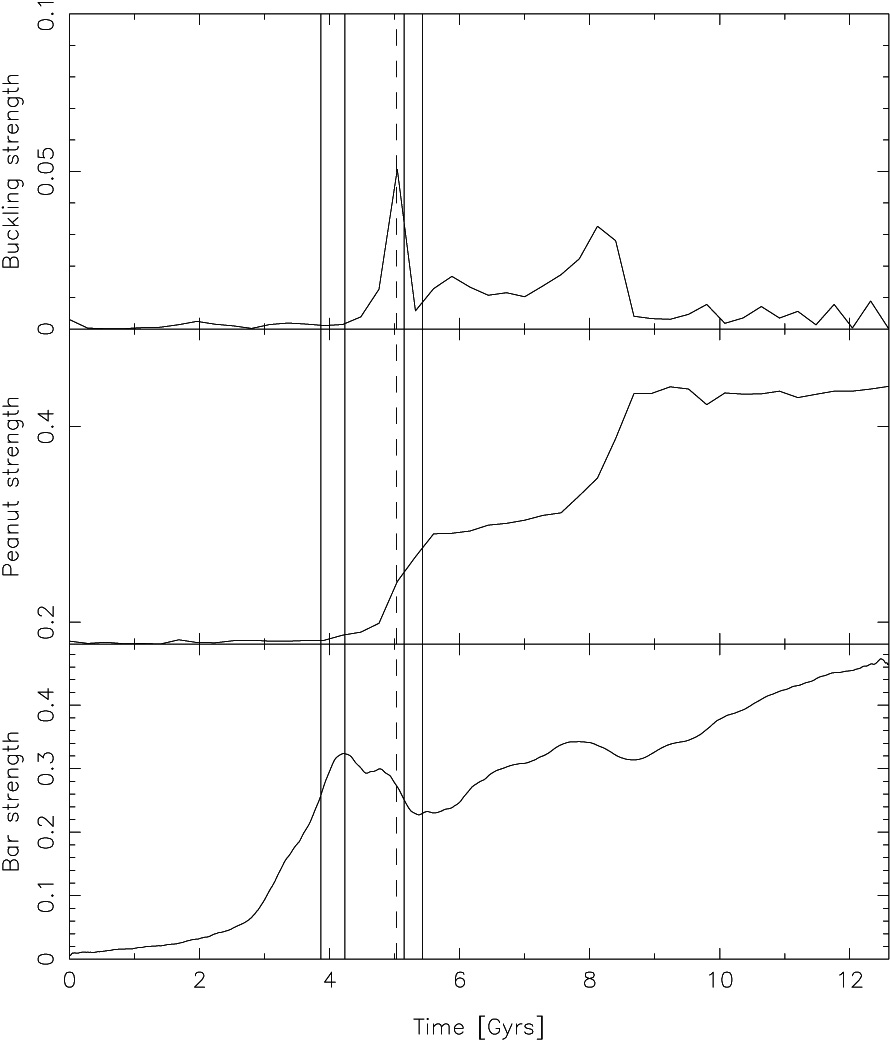 |
Figure 1. Time evolution of three peanut-, or bar-related quantities, namely the buckling strength (i.e. the vertical asymmetry; upper panel), the peanut strength (i.e. its vertical extent; middle panel) and the bar strength (lower panel). The solid vertical lines mark characteristic times linked to bar formation and evolution. From left to right, these are the bar formation time, the maximum amplitude time, the bar decay time and the bar minimum amplitude time (see text). The vertical dashed line marks the time of the buckling. |
The upper panel shows the buckling strength, i.e. the vertical asymmetry as a function of time. The disc is vertically symmetric before and during bar formation and the first indications of asymmetry occur only after the bar amplitude has reached a maximum. The asymmetry then grows very abruptly to a strong, clear peak and then drops equally abruptly. The time of the buckling (dashed vertical line) is given by the peak of this curve and is very clearly defined. It is important to note that, to within the measuring errors, it coincides with the time of bar decay (third vertical line). This is not accidental. I verified it for a very large number of simulations and thus can establish the link between the buckling episode and the decay of the bar strength (Raha et al. 1991; Martinez-Valpuesta & Shlosman 2004).
The middle panel shows the strength of the peanut, i.e. its vertical extent, again as a function of time. This quantity grows abruptly after the bar has reached its maximum amplitude and during the time of the buckling. This abrupt growth is followed by a much slower increase over a longer period of time. Taken together, the three panels of Fig. 1 show that the bar forms vertically thin, and only after it has reached a maximum strength does the buckling phase occur. During the buckling time the bar strength decreases significantly, while the the B/P strength increases. The time intervals during which bar formation, peanut formation, or buckling occur are all three rather short, of the order of a Gyr, and they are followed by a longer stretch of time during which the bar and B/P evolve much slower. This later evolution is often referred to as secular evolution.
This particular simulation has a second, weaker buckling episode shortly after 8 Gyrs. This occurs very often in simulations developing strong bars and was discussed first by Athanassoula (2005b) and Martinez-Valpuesta et al. (2006). It is seen clearly in all three panels and has characteristics similar to those of the first buckling.
2.2. Peanut formation and collective effects
As already discussed, orbital structure theory explains B/P formation
by the vertical
instabilities of the main family of bar-supporting periodic orbits.
An alternative approach explains the buckling and the peanut formation as
due to the bending, or fire-hose, instability, studied analytically in
the linear regime
(Toomre 1966;
Araki 1985).
These studies assign a critical value to the ratio
R =
z2
/ r2
igniting
the onset of the instability, which is around 0.1. A number of
simulations, however, have shown that the vertical instability sets in
at much larger values of
R
(e.g.
Merritt
& Sellwood 1994;
Sotnikova & Rodionov 2003).
=
z2
/ r2
igniting
the onset of the instability, which is around 0.1. A number of
simulations, however, have shown that the vertical instability sets in
at much larger values of
R
(e.g.
Merritt
& Sellwood 1994;
Sotnikova & Rodionov 2003).
To test this hypothesis, I calculate the radial and z
components of the disc velocity dispersion
as a function of radius (averaging over azimuth and height). I then
find the minimum value of their ratio
R and
plot its time evolution in Fig. 2.
The thin vertical lines mark two characteristic times linked
to bar formation and evolution - namely the bar
maximum and minimum amplitude times - as found from
Fig. 1.
Their location is clearly linked to changes in behaviour
of R.
This, however, does not necessarily imply that the changes in
R are
the cause of the buckling, but can also be seen
as its consequence. Indeed, as the bar forms
r increases
drastically, so that
R
decreases. Then the bar
amplitude reaches its maximum and starts decreasing, while the peanut
starts forming. During this time,
r decreases while
z
increases. As a result, the ratio
R reaches
a minimum when the bar amplitude is maximum and then increases again,
as is indeed seen in Fig. 2. Then the
bar amplitude reaches a minimum, which corresponds to a minimum of
r and
therefore to a maximum of
R.
This is followed by a slower decrease of
R,
which is stopped by the second buckling episode. The value of
R at
which this instability sets in is much less extreme than that predicted
by the above mentioned analytical works, but is in good
agreement with other N-body simulations.
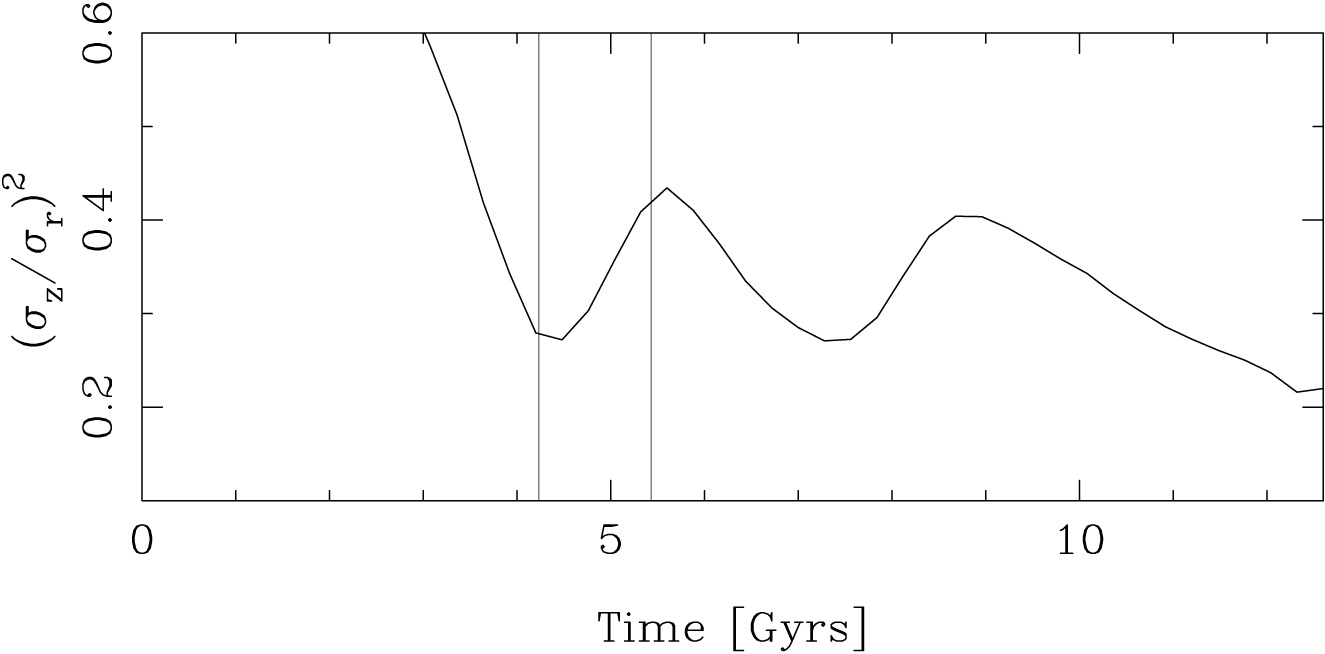 |
Figure 2. Time evolution of the ratio
R |
More work is necessary before we fully understand the respective roles of the orbital structure results and of the velocity anisotropy effects on the formation and evolution of B/P structures. Both explain part of the story, but many aspects of their interplay are still unclear. Orbital structure results tell us whether the appropriate building blocks are available, or not, and this is essential, since the lack of such building blocks prohibits the formation of a given structure. Furthermore, studies of the properties of the building-block orbits are essential for understanding the properties of the B/P structures. Orbital structure theory, however, can not tell us how much matter is trapped around a given orbit or family. Furthermore, it is necessary to group all these building blocks into one coherent, self-consistent unit and here collective effects are essential. Like orbital structure, they also can set limits on the formation of B/P structures, as well as give information on their properties. The respective input from the two methods will be discussed further elsewhere.
2.3. Comparison with observations
The fact that B/Ps are just parts of bars seen edge-on was not immediately accepted (see e.g. Kormendy 1993). The main arguments against it were, however, refuted in A05, with the help of orbital structure results. Furthermore, considerable observational evidence argues in its favour, particularly detailed comparisons between observations and simulations.
Radial density profiles from simulations, taken along slits on, or parallel to, the equatorial plane when the galaxy is seen edge-on (AM02; A05) have the same characteristic signatures as the corresponding radial light profiles (Lütticke, Dettmar & Pohlen 2000; Bureau et al. 2006). Similarly, density profiles along cuts perpendicular to the equatorial plane (AM02; A05) show similar characteristics to analogous observed light profiles (Aronica et al. 2003 and this volume). Further tests come from comparisons of median filtered images of B/P systems (Bureau et al. 2006) to similar images of N-body bars (A05). These show the same types of characteristic features, namely four extensions out of the equatorial plane, which form an X-like shape, except that the four extensions do not necessarily cross the centre. Another common feature is maxima of the density along the equatorial plane, away from the centre and diametrically opposite. Starting from the centre of the galaxy and going outwards along the equatorial plane, the projected surface density first drops, then increases again to reach a local maximum and then decreases again to the edge of the disc.
Considerable evidence was also accumulated using kinematical observations. Cylindrical rotation, witnessed in a number of B/P galaxies (KK04 and references therein), is also seen in velocity fields of strong N-body bars viewed edge-on (Combes et al. 1990; AM02). Emission line spectroscopy of boxy/peanut galaxies (Kuijken & Merrifield 1995; Bureau & Freeman1999; Merrifield & Kuijken 1999) shows that their major axis position velocity diagrams (PVDs) have a number of interesting features, well reproduced by gas flow simulations (Athanassoula & Bureau 1999). In particular, the shocks along the leading edges of the bar and the corresponding inflow lead to a characteristic gap in the PVDs, between the signature of the nuclear spiral (whenever existent) and the signature of the disc.
Comparison of long-slit absorption line spectra (Chung & Bureau 2004) of galaxies with B/Ps to similar `observations' of N-body bars viewed edge-on reveals that the two have the same characteristic features (Bureau & Athanassoula 2005). The integrated light along the slit (equivalent to a major-axis light profile) has a quasi-exponential central peak and a plateau at intermediate radii, followed by a steep drop. The rotation curve (V(r)) has a characteristic double hump. The velocity dispersion has a central peak, which in the centre-most part may be rather flat or may even have a central minimum. At intermediate radii there can be a plateau which sometimes ends on either side with a shallow maximum before dropping steeply at larger radii. h3 (i.e. the coefficient of the third order term in a Gauss-Hermite expansion of the line of sight velocity distribution) correlates with V over most of the bar length, contrary to what is expected for a fast rotating disc. All these features are spatially correlated and are seen, more or less strongly, both in the observations and in the simulations (Bureau & Athanassoula 2005).
In collaboration with Martinez-Valpuesta, I made an extensive statistical study of a few hundred simulations which I had run for different purposes (AM02; A03 etc). We measured the strength of the peanut (from its thickness) and its shape (from the shape of the density profile on cuts perpendicular to the equatorial plane) and found that both correlate well with the bar strength. Thus, stronger bars have stronger peanuts and more flat-topped vertical density profiles. I also find that the type of halo plays a major role in determining the properties of the B/P. Fig. 3 shows histograms of the number of bucklings that have occurred, of the bar strength, of the B/P strength and of the B/P shape, distinguishing between simulations with small halo cores and simulations with large halo cores. The two populations are indeed very different. Simulations with small halo cores have stronger bars, stronger peanuts, more flat-topped vertical density profiles and have experienced more bucklings than simulations with large cores. The few simulations with small cores which have weak bars, weak B/Ps and did not buckle have either a very hot halo or a very hot disc. Simulations with cuspy haloes (not shown here) have yet weaker B/Ps and smaller number of bucklings and will be discussed elsewhere.
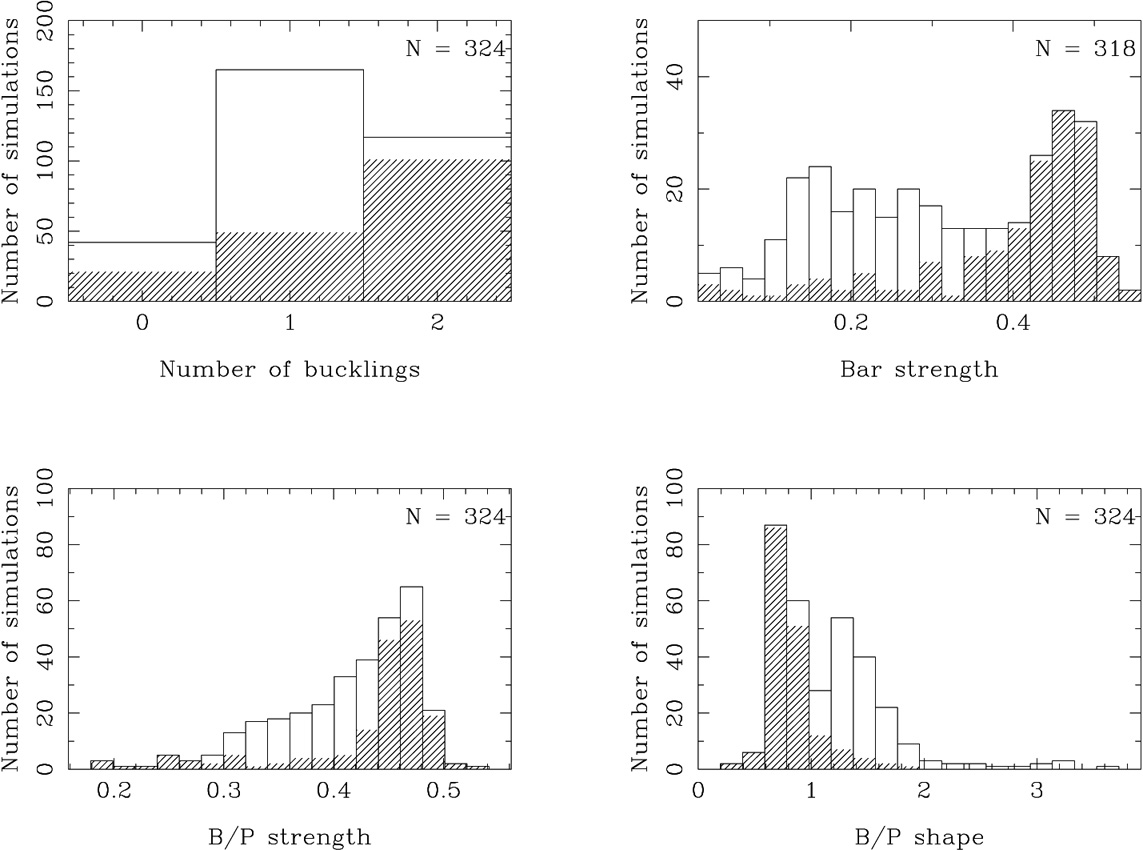 |
Figure 3. Histograms of number of bucklings, bar strength, B/P strength and B/P shape for a sample of fully self-consistent high-resolution simulations. The histograms include simulations with halo cores of all sizes and the hatched areas includes only simulations with small halo cores. |
The above can be explained by the fact that the halo plays a major role in determining the properties of the bar (AM02; A03). Athanassoula (2002, hereafter A02) showed that angular momentum is primarily emitted by near-resonant material in the bar region and absorbed by near-resonant material in the outer disc and, particularly, in the halo, while A03 showed that bars grow stronger when more angular momentum is exchanged within the galaxy. Furthermore, as shown in AM02 and as explained in A02 and A03, the size of the halo core strongly influences the bar evolution. Haloes with a small core have a lot of mass in the inner regions and thus, provided their velocity dispersion is not too high, can provide substantial angular momentum sinks and lead to considerable angular momentum exchange between the near-resonant particles in the bar region and the near-resonant particles in the halo. Such models grow strong bars (long, thin and massive) with rectangular-like isodensities (AM02). Viewed side-on (i.e. edge-on with the line-of-sight along the bar minor axis) they exhibit a strong peanut, or even X-like shape. If, however, the velocity dispersion in the disc and/or halo is too high, the angular momentum exchange is hindered and the bar and peanut will be weak (A03). Haloes with large cores have considerably less material in the inner parts and are thus capable of less angular momentum exchange. Bars grown in such environments are less strong, have elliptical-like isodensities when viewed face-on and boxy-like when viewed side-on. All these considerations explain the results found in Fig. 3, namely the difference between the histograms for simulations with small halo cores and simulations with large halo cores. They also explain the weak bars and B/Ps found in some simulations with small halo cores.