


3.1. The first objects with a soft X-ray excess discovered: Virgo (redshift z = 0.0038) and Coma (z = 0.0231)
The first mention of soft excess emission in the 0.065-0.245 keV band was made by Lieu et al. (1996a) for the Virgo cluster, based on data obtained with the EUVE satellite. These authors detected emission around M 87 up to a radial distance of ~ 20', and found excess emission over the best fit single temperature plasma model obtained by fitting simultaneously the EUVE and ROSAT PSPC 0.18-2.0 keV data. This excess was found to decrease with radial distance (see Fig. 1). Similar results were then found for the Coma cluster, also based on EUVE and ROSAT data, by Lieu et al. (1996b).
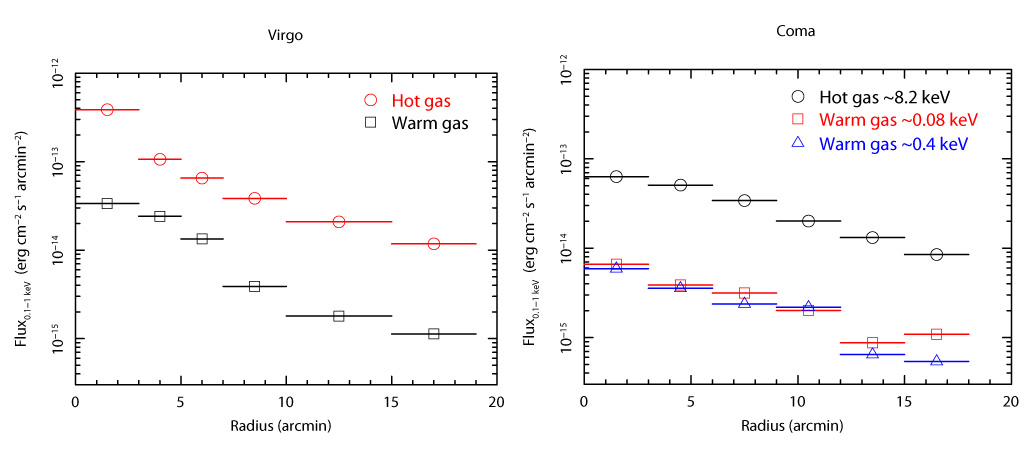 |
Figure 1. Left panel: Radial profiles of the 0.1-1.0 keV surface brightness of the hot ICM and of the warm gas in Virgo found by Lieu et al. (1996a). Right panel: Radial profile of the 0.1-1.0 keV surface brightness of the hot ICM and of the two warm gas components in Coma found by Lieu et al. (1996b). |
The first interpretation proposed was that the soft excess emission was
thermal, with a single component of ICM gas at a temperature
between 5 × 10⁵ K and 106 K for Virgo
(Lieu et al. 1996a)
and two components at 8 × 10⁵ K and 2 ×
106 K for Coma
(Lieu et al. 1996b).
The
immediate implication of this hypothesis was that such warm gas would
cool very rapidly, implying a very high mass accretion rate of several
hundred Solar masses per year, and therefore the production of a large
amount of gas in the cool phase (of the order of 1014
M ,
Lieu et al. 1996a,
b).
,
Lieu et al. 1996a,
b).
A second model was then proposed by Sarazin & Lieu (1998), in which soft excess emission was due to the Inverse Compton emission (hereafter IC) of cosmic microwave background photons on a relic population of cosmic ray electrons. Such electrons could have been produced by supernovae, by radio galaxies or by particle acceleration in intracluster shocks. Their energy would amount to 1-10% of the thermal energy content of the ICM. The inverse Compton model was also favoured by Bowyer & Berghöfer 1998), and Lieu et al. (1999a) suggested that cosmic rays could be as energetically important as the thermal ICM.
From ROSAT images at low energy, Bonamente et al. (2001a) derived the existence of large amounts of cold gas in the ICM of Virgo and Coma, confirming the existence of a multiphase ICM.
More clusters were then observed, Virgo and Coma were reobserved, and controversy began to arise concerning the very existence of a soft excess over the thermal emission from hot gas responsible for cluster X-ray emission.
An agreement on the existence of soft excess emission based on EUVE and ROSAT PSPC data was reached by different observers only on the Virgo and Coma clusters. By taking into account the variations of telescope sensitivity over the field of view, Bowyer & Berghöfer (1999) confirmed the presence of EUV excess emission in Coma. These authors also later confirmed the soft excess in Virgo and interpreted it as due to inverse Compton radiation (Berghöfer & Bowyer 2000a). With EUVE in situ background measurements, Bonamente et al. (2001b) agreed with the existence of an EUV excess in Virgo and found that this excess increased with radius.
Using PSPC data, Bonamente et al. (2003) found a very large scale (2.6 Mpc) soft excess halo in the Coma cluster, exceeding the thermal emission by 200% at the largest radii. Note that at a distance of 40' the soft excess flux exceeds that of the hot gas by 100%, consistent with the later XMM-Newton analysis of Finoguenov et al. (2003) at the same distance. The non-thermal model gave a poor fit to the spectrum of the soft excess, while the thermal model was acceptable, with a best-fit temperature of ~ 0.2 keV.
3.2. Other clusters observed with EUVE and ROSAT
A strong soft excess was found in Abell 1795 from EUVE data by Mittaz et al. (1998). Later, Bonamente et al. (2001) confirmed the existence of this excess by observing with EUVE an in situ background, and found that, as for Virgo, the EUV excess increased with radius.
However, these results were debated: by taking into account the variations of telescope sensitivity over the field of view, Bowyer & Berghöfer (1999) claimed that there was no evidence for EUV excess in Abell 1795 and later confirmed this result from BeppoSAX data (Berghöfer & Bowyer 2002). However, the existence of soft excess emission in this cluster was confirmed by Durret et al. (2002) from EUVE and ROSAT PSPC data. Soft excess in Abell 1795 was also found with the ROSAT PSPC (Bonamente et al. 2003) at the 10-20% level in the 0.2-0.4 keV band, and by Nevalainen et al. (2003) and Kaastra et al. (2003), both based on XMM-Newton data (see Sect. 4.2.1 and 4.2.2, respectively).
The presence of a soft excess was disputed in Abell 2199. From EUVE data, Lieu et al. (1999b) detected a soft excess, and confirmed its existence up to a radius of 20' using a background measured from offset pointing Lieu et al. (1999c). Confirmation of the existence of a soft and a hard excess in this cluster was given by Kaastra et al. (1999) based on BeppoSAX, EUVE and ROSAT data. A three phase ICM was proposed to account for the observations by Lieu et al. (2000).
On the other hand, from other EUVE observations taking into account the variations of telescope sensitivity over the field of view, Bowyer & Berghöfer (1999) found no evidence for EUV excess. They confirmed this result with BeppoSAX data (Berghöfer & Bowyer 2002), but Kaastra et al. (2002) claimed that their analysis was wrong. According to the latter authors, the problem was that Berghöfer & Bowyer based their conclusion on a plot of the ratio of the observed radial intensity profiles in the 0.5-2.2 keV band as compared to the 0.1-0.3 keV band. Because the point spread function of the BeppoSAX LECS instrument is a strong function of energy (10' FWHM at E = 0.28 keV, scaling as E-0.5), and the low-energy counts in the 0.1-0.3 keV band contain a significant contribution from higher energy photons, even for a fully isothermal cluster the ratio of the radial intensities in both bands shows strong (~ 50%) excursions. Moreover, the predicted ratio depends strongly on issues like abundance gradients, modelling of the cooling flow, etc. that were ignored by Berghöfer & Bowyer (2002).
The existence of a soft excess was independently confirmed by Durret et al. (2002) from EUVE and ROSAT PSPC data. The ROSAT PSPC analysis of Bonamente et al. (2003) also revealed marginal evidence for soft excess in Abell 2199, and they derived that the temperature of the soft excess component must be below 0.2 keV. Kaastra et al. (2003) confirmed the presence of a soft excess in this cluster from XMM-Newton data.
No soft excess was detected in Abell 4059 by Berghöfer & Bowyer (2000b); strangely, these authors even found a deficit of EUV emission in the central 2'. However, a soft excess was detected in this cluster by Durret et al. (2002) as described in the next subsection.
3.2.4 Complementary results on the five above clusters
A different approach was proposed by Durret et al. (2002) based on the wavelet analysis and reconstruction of EUVE and ROSAT PSPC observations for the five previously discussed clusters: Virgo, Coma, Abell 1795, Abell 2199 and Abell 4059. A soft excess was found in all five clusters, even when taking into account temperature and abundance gradients of the ICM. The radial profiles of the EUV to X-ray ratios are shown in Fig. 2. The EUV and X-ray profiles were shown to differ statistically, suggesting that the EUV and X-ray emissions were probably not due to the same physical mechanism.
 |
Figure 2. EUV to X-ray ratio as a function of cluster radius (expressed in arcmin in the left plot and in kpc in the right plot) for the five clusters observed by Durret et al. (2002) with the EUVE and ROSAT PSPC satellites. The symbols are the following: Abell 1795: filled triangles, Abell 2199: empty squares, Abell 4059: empty circles, Coma: empty triangles, Virgo: filled squares. The dashed line in the left figure shows the ratio of the EUVE to ROSAT PSPC PSFs. Error bars are omitted for clarity; they are typically smaller than ± 0.01 in logarithmic scale, i.e. too small to be clearly visible on the figure. |
No soft excess was detected in Fornax by Bowyer et al. (2001) at any scale, but Bonamente et al. (2002) did detect a soft X-ray excess in this cluster, which is part of the sample described in Sect. 3.2.9.
3.2.6 Shapley supercluster (z = 0.046)
The ROSAT PSPC data of four clusters Abell 3571, Abell 3558, Abell 3560 and Abell 3562 in the Shapley supercluster were analysed by Bonamente et al. (2001b). They modelled the hot gas spectra using published ASCA results (Abell 3571 and Abell 3558) or fitting the PSPC data (Abell 3560 and Abell 3562). These models fit the PSPC data poorly due to excess residuals in the R2 band (0.15-0.3 keV) in all clusters. Based on the residuals, the authors determined the fractional soft excess emission above the hot gas emission model, amounting to 50% at most. For Abell 3571 and Abell 3558, they found that the fractional soft excess increased with the cluster radius, an effect already found in the EUVE data of Virgo, Abell 1795, and Abell 2199 (Bonamente et al. 2001b, Lieu et al. 1999b).
BeppoSAX LECS data on Abell 3571 and Abell 3562 supported the PSPC results. The analysis showed that a simple one-temperature thin-plasma model is not adequate to describe the emission.
The data indicated a thermal model with kT = 0.1 keV for Abell 3558, but the quality of the data was not appropriate for distinguishing the nature of the soft component or modelling its properties in detail.
3.2.7 Sérsic 159-03 (z = 0.0580)
Sérsic 159-03 (also known as AS 1101) was found to show strong soft excess and even to be the brightest soft excess cluster by Bonamente et al. (2001d). These authors combined three PSPC pointings of Sérsic 159-03 obtaining 19 ks of exposure time. The low temperature (~ 2 keV) of the hot gas allowed its spectroscopic analysis using the PSPC data alone. Extrapolating the best-fit spectral model from the 0.5-2.0 keV band to lower energies revealed a very strong soft excess at 0.2 keV, 100% over the hot gas emission. This excess was then confirmed with XMM-Newton (see Sect. 4.1.3).
Bonamente et al. (2001d) tested the hypothesis that the soft excess could be an artefact caused by a sub-Galactic absorbing column density NH towards the cluster. However, this yielded an unrealistically low NH (5 × 1019 cm-2), even lower than that of the global minimum of the Lockman Hole, implying that NH variation is not the cause of the soft excess in this cluster.
Despite the high quality of the signal, the nature of the soft excess component could not be determined, since non-thermal and thermal models yield statistically equally acceptable fits.
3.2.8 The Hercules supercluster (z ~ 0.035)
A soft excess was also detected from low energy ROSAT data in the clusters Abell 2052 (z = 0.0348) and Abell 2063 (z = 0.0348) of the Hercules supercluster (Bonamente et al. 2005b); however these authors underlined the difficulty of background subtraction.
3.2.9 The Bonamente et al. (2002) sample
Bonamente et
al. (2002)
published a ROSAT PSPC analysis of the largest
soft excess sample of galaxy clusters so far, 38 in number. They
modelled the ROSAT PSPC data of the hot gas using published results
from ASCA and BeppoSAX which are more suitable due to their energy
coverage up to 10 keV. These models were extrapolated to the PSPC
channels and compared with the data in the 0.2-0.4 keV band. The
analysis yielded significant
(3 ) soft excess in ~ 30% of
the clusters in the sample. The actual fraction of clusters with soft
excess may be higher, since the clusters with the deepest ROSAT
observations all had soft excess. Using a thermal model with a
temperature of 0.08 keV and metal abundance of 0.3 Solar, or a
power-law I = I0
E-
) soft excess in ~ 30% of
the clusters in the sample. The actual fraction of clusters with soft
excess may be higher, since the clusters with the deepest ROSAT
observations all had soft excess. Using a thermal model with a
temperature of 0.08 keV and metal abundance of 0.3 Solar, or a
power-law I = I0
E- ph (where I is the intensity
and E the photon energy) of index
ph = 1.75,
the soft excess fluxes correspond to 0.2-0.4 keV luminosities of
1040 - 1043 erg s-1. The excess was
more prominent in the regions outside the central 150-200 kpc.
ph (where I is the intensity
and E the photon energy) of index
ph = 1.75,
the soft excess fluxes correspond to 0.2-0.4 keV luminosities of
1040 - 1043 erg s-1. The excess was
more prominent in the regions outside the central 150-200 kpc.
The indicated increase of the relative strength of the soft excess with radius is qualitatively consistent with the non-thermal Inverse Compton radiation of CMB photons from the relativistic cluster electrons. The hot gas emission is proportional to ne,thermal2 while the IC is proportional to ne,relativistic and the usual assumption is that the relativistic electrons follow the gas distribution. This model however faces energetic problems.
The authors also examined the possibility that the soft excess originates from a large number of unresolved X-ray-emitting cluster galaxies. The most relevant sources of X-rays are Low Mass X-ray Binaries (LMXB) and especially their kT ~ 0.25 keV blackbody component coming from the accretion disk. The typical soft X-ray luminosity of a galaxy due to LMXB is of order 1038 erg s-1 and thus 103 - 104 galaxies are needed to produce the typical observed soft X-ray luminosity, while typical numbers of galaxies in rich clusters are of order several hundreds. Thus, unresolved sources in cluster galaxies cannot explain the soft excess. A similar conclusion can be reached by looking at the galaxy X-ray luminosity function, such as that obtained for the Coma cluster by Finoguenov et al. (2004); in view of the relatively faint X-ray luminosities of the individual galaxies, the number of X-ray emitting galaxies required to account for the soft excess would be unrealistically high.