Copyright © 2006 by Annual Reviews. All rights reserved
| Annu. Rev. Astron. Astrophys. 2006. 44:
323-366 Copyright © 2006 by Annual Reviews. All rights reserved |


It is well known that the Milky Way hosts both old and young luminous X-ray source populations, reflecting its general stellar makeup. In the luminosity range detectable in most external galaxies with typical Chandra observations (> 1037 erg s-1), these Galactic populations are dominated by XRBs, and include both low-mass X-ray binaries (LMXBs) and high-mass X-ray binaries (HMXBs) (Table 1). A few young supernova remnants (SNRs) may also be expected. At lower luminosities, reachable with Chandra in Local Group galaxies, Galactic sources include accreting white dwarfs and more evolved SNRs (see, e.g., the review by Watson 1990 for a census of Galactic X-ray sources; Grimm, Gilfanov & Sunyaev 2002 for a study of the X-ray luminosity functions of the Galactic X-ray source populations; White, Nagase & Parmar 1995 for a review of the properties of Galactic X-ray binaries; Verbunt & van den Heuvel 1995 for a review on the formation and evolution of XRBs; Fender & Belloni 2004 on the spectral states of black-hole binaries). Figure 1 shows the cumulative X-ray luminosity functions (XLFs) of LMXBs and HMXBs in the Galaxy (Grimm, Gilfanov & Sunyaev 2002). Note the high luminosity cut off of the LMXB XLF and the power-law distribution of the HMXB XLF; these basic characteristics are echoed in the XRB populations of external galaxies (Section 3.3 and Section 4.2).
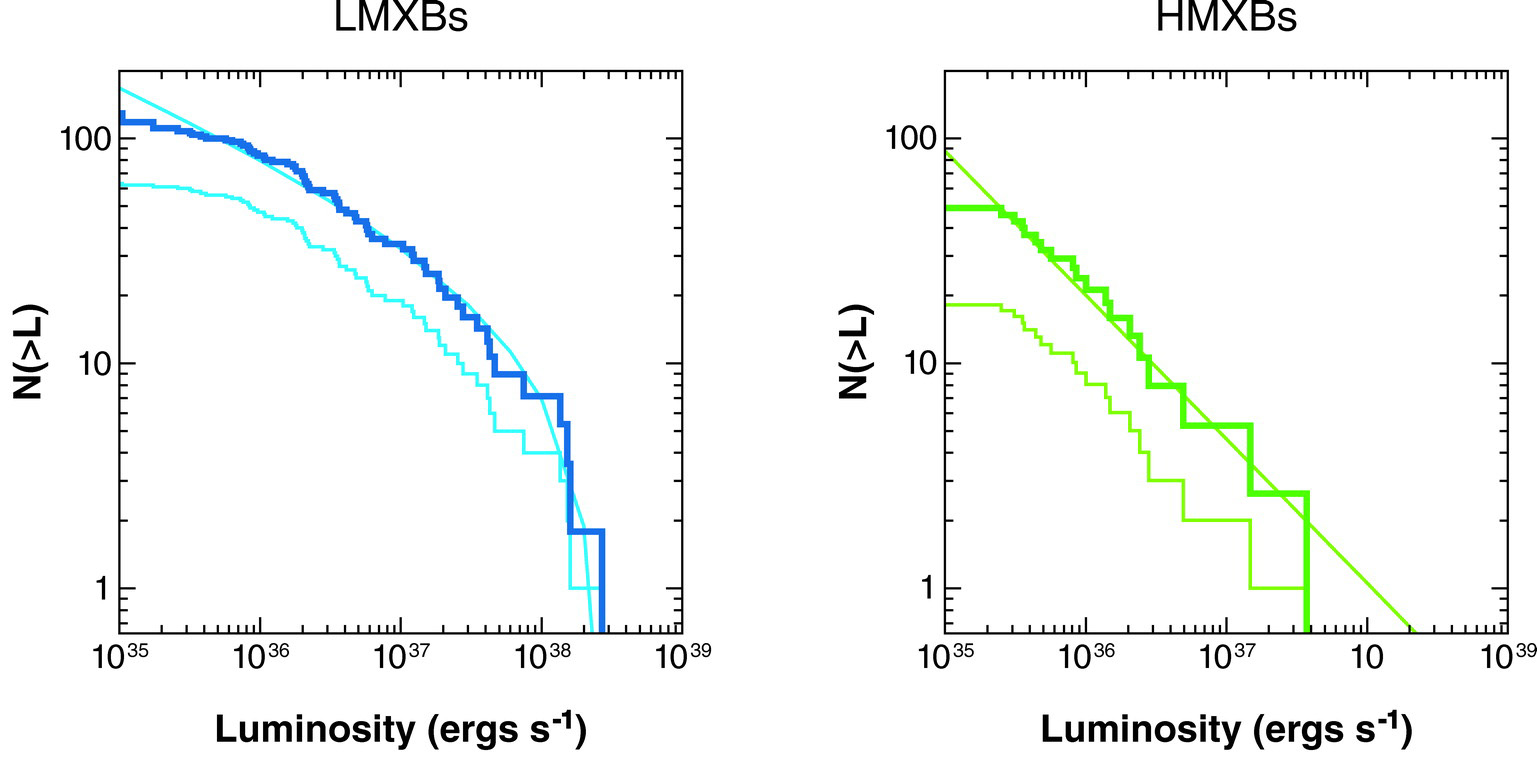 |
Figure 1. Cumulative X-ray luminosity
functions (XLFs) of Galactic low-mass X-ray binaries (LMXBs,
left) and high-mass X-ray binaries (HMXBs, right), from
figure 12 of
Grimm, Gilfanov &
Sunyaev (2002).
A mass of 2.5M |
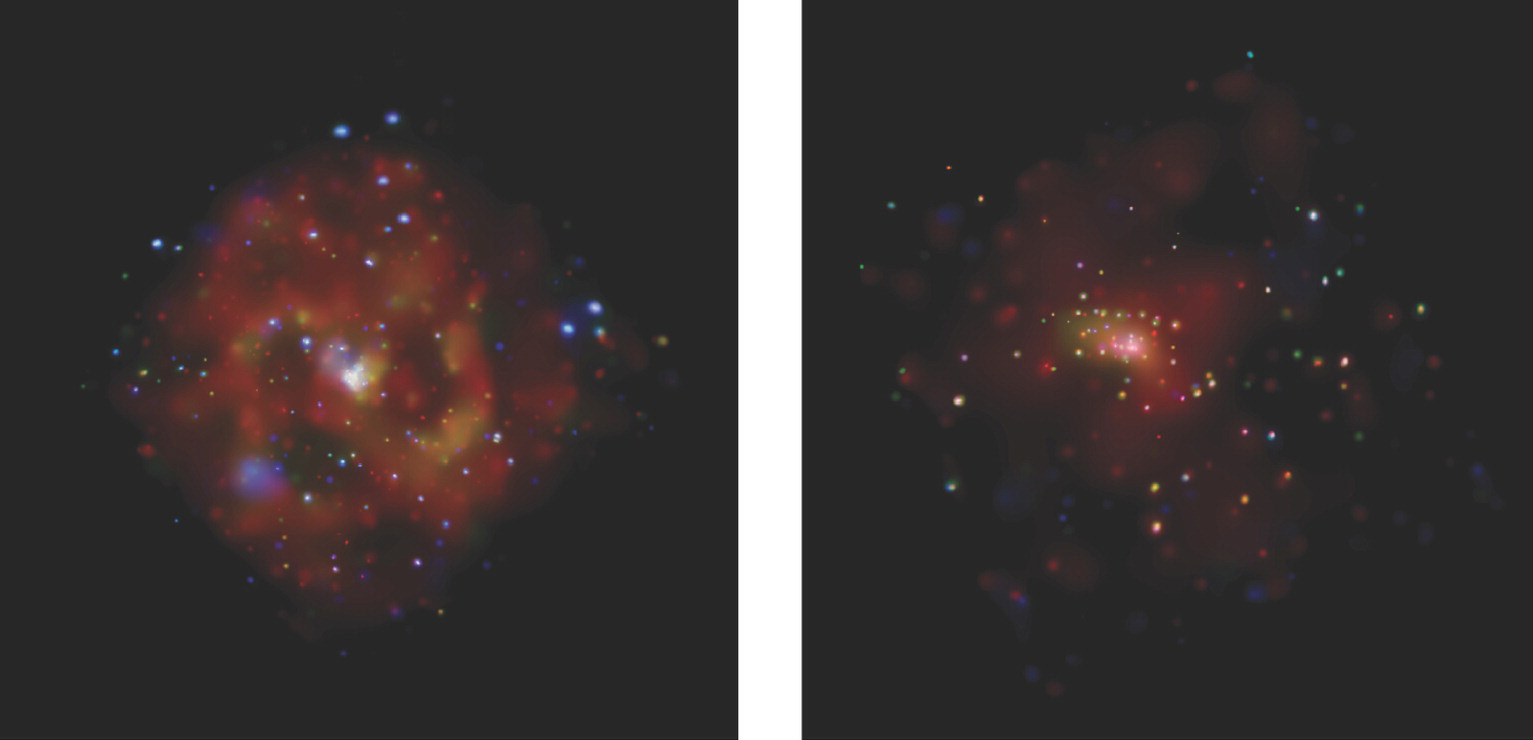 |
Figure 2. Chandra ACIS images of M83 (left, box is 8.57 × 8.86 arcmin) and NGC4697 (right, box is 8.64 × 8.88 arcmin). See text for details. Both images are from the Web page http://chandra.harvard.edu/photo/category/galaxies.html; credit NASA/CXC). |
The X-ray CCD detectors (present both in Chandra and XMM-Newton) provide us with a data-hypercube of the observed area of the sky, where each individually detected photon is tagged with a two-dimensional position, energy, and time of arrival. Therefore, for each detected source, we can measure flux (and luminosity), spectral (or photometric) parameters, and time variability. For the most intense sources, it is also possible to study the time variability of spectra if the galaxy has been observed at different epochs (which is still rare in the available data set; see, e.g., Fabbiano et al. 2003a, b). To analyze this wealth of data two approaches have been taken: (a) a photometric approach, consisting of X-ray color-color diagrams and color-luminosity diagrams, and (b) X-ray luminosity functions.
The use of X-ray colors to classify X-ray sources is not new. For example, White & Marshall (1984) used this approach to classify Galactic XRBs, and Kim, Fabbiano & Trinchieri (1992) used Einstein X-ray colors to study the integrated X-ray emission of galaxies. Given the lack of standard X-ray photometry to date, different definitions of X-ray colors have been used in different works; in the absence of instrument corrections, these colors can only be used for comparing data obtained in the same observational set up. Colors, however, have the advantage of providing a spectral classification tool when only a limited number of photons are detected from a given source, which is certainly the case for most X-ray population studies in galaxies.
Compared with the traditional X-ray data analysis approach of deriving spectral parameters via model fitting, color-color diagrams provide a relatively assumption-free comparison tool. Early Chandra-based examples of this approach can be found in Zezas et al. (2002a, b) and Prestwich et al. (2003). Color diagrams are used frequently to classify the discrete source populations of galaxies (see Sections 3 and 4); although useful, it is important to remember that some ambiguity in the outcome is unavoidable. Both the choice of spectral boundaries and the sensitivity of a given telescope-detector combination are important (see, for example, the identification of supersoft and quasi-soft sources, Pietsch et al. 2005, Di Stefano et al. 2004; Section 5). Moreover, both spectrum and flux of XRBs may vary in time, so that the classification of a given source may change when repeated observations become available.
2.2. X-Ray Luminosity Functions
Luminosity functions are a well-known tool of observational astrophysics. XLFs have been used to characterize different XRB populations in the Milky Way (e.g., Grimm, Gilfanov & Sunyaev 2002; see Figure 1), but these studies have always required a model of the spatial distribution of the sources, and of the intervening absorption, in order to estimate their luminosities; these corrections are inherently sources of uncertainty. External low-inclination galaxies, instead, provide clean source samples all at the same distance. Moreover, the detection of X-ray source populations in a wide range of different galaxies allows us to explore global population differences that may be connected with the age and or metallicity of the parent stellar populations. XLFs establish the observational basis of X-ray population synthesis (Belczynski et al. 2004). The first early attempts to construct and compare XLFs of X-ray source populations in external galaxies include the comparisons of the XLFs of M31 and of the disk of M81 with Einstein data (Fabbiano 1988; see also Fabbiano 1995), concluding that in M81 there is a relative surplus of very luminous sources, and the conclusion of a flat XLF in M101, connected with massive accreting young binaries (Trinchieri, Fabbiano & Romaine 1990). These early results are in general agreement with the trends suggested by the XLFs of LMXB and HMXB in the Milky Way (Figure 1) and with the results discussed in this review.
In principle XLFs are simple to construct, but care must be taken to apply corrections for observational biases and statistical effects. These include the incomplete detection of low-luminosity sources that may cause flattening of the XLF at the low-luminosity end; the artificial "brightening" of threshold sources because of statistical fluctuations (Eddington bias; Eddington 1913); the varying amount of diffuse emission around the source from a hot ISM (e.g., Zezas & Fabbiano 2002), which affects the detection threshold; and source confusion in crowded regions especially near the galaxy centers. In the case of Chandra the detection efficiency is also affected by the radial dependence of the degradation of the mirror resolution off-axis (see Kim & Fabbiano 2003, 2004; Gilfanov 2004). These low-luminosity biases have not been treated consistently in the literature, giving rise in some cases to potentially spurious results (Section 3.3). For galaxies extending over large angular sizes, the effect of background active galactic nuclei (AGNs) and stellar interlopers in the XLF must also be considered (e.g., Finoguenov & Jones 2002, Gilfanov 2004, Grimm et al. 2005).
At the high luminosity end, the paucity of very luminous X-ray sources in galaxies makes uncertain the parameterization of the XLF of individual populations; this problem has been approached by coadding "consistent" samples of X-ray sources (Kim & Fabbiano 2004). This same effect is responsible for uncertainties in the measurement of the total X-ray luminosity of a galaxy from the relatively small number of X-ray sources detected in short or insensitive observations (Gilfanov, Grimm & Sunyaev 2004b).
Compact X-ray sources are notorious for their variability and this variability could in principle also affect the XLF, which is typically derived from a snapshot of a given galaxy. However, repeated Chandra observations in the cases of NGC5128 (Kraft et al. 2001), M33 (Grimm et al. 2005) and the Antennae galaxies (Zezas et al. 2004) empirically demonstrate that the XLF is remarkably steady against individual source variability.
 for the companion star was used as a boundary between LMXBs and HMXBs.
The thin and thick histograms are the apparent and volume-corrected
distributions, respectively. The lines are the best fits to the
volume-corrected distributions: a power law with cumulative slope
-0.64 ± 0.15 for the HMXBs and a power law (slope, -0.26 ±
0.08) truncated at ~ 2.7 × 1038 erg s-1
for the LMXBs. Note that a similar HMXB power law is also found in the
X-ray binaries populations of star-forming galaxies
(
for the companion star was used as a boundary between LMXBs and HMXBs.
The thin and thick histograms are the apparent and volume-corrected
distributions, respectively. The lines are the best fits to the
volume-corrected distributions: a power law with cumulative slope
-0.64 ± 0.15 for the HMXBs and a power law (slope, -0.26 ±
0.08) truncated at ~ 2.7 × 1038 erg s-1
for the LMXBs. Note that a similar HMXB power law is also found in the
X-ray binaries populations of star-forming galaxies
( -1, for
LX > 2 × 1037 erg s-1,
-1, for
LX > 2 × 1037 erg s-1,