


The need for understanding the star formation histories of dwarf galaxies was recognized long ago and over the years many approaches have been followed to infer the SFH of different galaxies. Among the many studies devoted to the field, we recall the seminal paper by [19] and the extensive and detailed analyses performed by Gallagher, Hunter and collaborators ([20, 21] and references therein), who used various indicators to estimate the star formation rates at different epochs of large samples of dwarfs. The quantum leap in the field occurred two decades ago, when the power and resolution of new generation telescopes and detectors allowed people to resolve and measure individual stars even in the crowded fields of external galaxies and to draw their CMDs. The CMD of a stellar system is in fact the best information desk on the system evolution, because it preserves the imprinting of all the relevant evolution parameters (age, mass, chemical composition, initial mass function).
Twenty years ago stellar age dating was done with isochrone fitting, a handy tool for simple stellar populations, such as those of stellar clusters, but inadequate to interpret the composite populations of galaxies, where many subsequent generations of stars, with possibly different initial mass function, metallicity, reddening and distance, contribute to the morphology of the observational CMD. With CCD detectors and new reduction packages for PSF fitting photometry allowing for the first time to measure accurately individual stars in Local Group (LG) galaxies, the time had come to develop a reliable tool to quantitatively derive their SFHs. The best tool is based on CMDs, and is the extrapolation of the standard isochrone fitting method to the complicated CMDs of composite stellar populations: the synthetic CMD method.
2.1. Building a synthetic population
The synthetic CMD method allows us to derive all the SFH parameters within the lookback time reached by the available photometry. To do this, a synthesizer works with classical ingredients:
 |
(1) |
The IMF is usually assumed to be independent of time;
The standard procedure is the following. Using a Monte Carlo algorithm, masses and ages are extracted according to the IMF and the SF law (e.g. constant or exponentially decreasing with time, proportional to some power of the gas density, etc.). The metallicity follows suitable AMRs. The extracted synthetic stars are placed in the CMD by interpolation among the adopted stellar evolution tracks of the assumed metallicity. In order to take into account the presence of unresolved binary stars, a chosen fraction of stars are assumed to be binaries and coupled with a companion star. The fake population is put at the distance of the galaxy we want to analyze, simultaneously correcting for reddening and extinction. Finally, photometric errors, incompleteness and blending factors, as accurately estimated from artificial star tests on the actual photometric images of the examined field, are applied to the synthetic CMD.
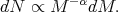
Different combinations of the parameter choices provide the whole variety of CMDs observed in real galaxies. As an example, Fig. 1 shows the CMDs resulting from 6 representative, although simplistic, cases.
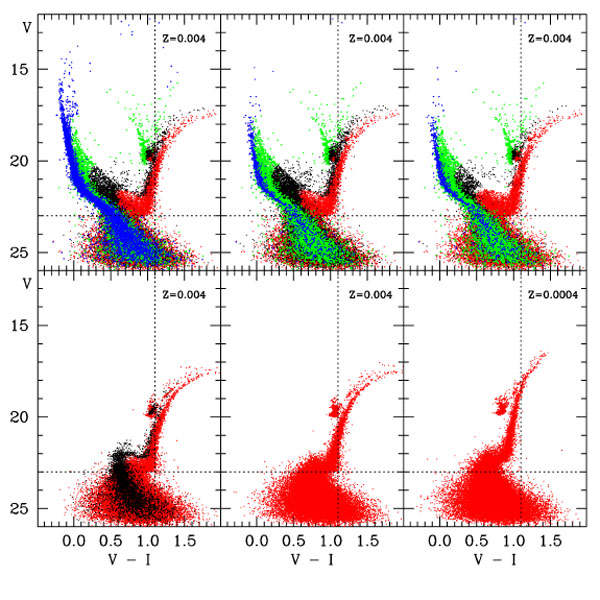 |
Figure 1. The effect of the SFH on the theoretical CMD of a hypothetical galactic region with (m - M)0 = 19, E(B - V) = 0.08, and with the photometric errors and incompleteness typical of HST/WFPC2 photometry. All the shown synthetic CMDs contain 50000 stars and are based on the Padova models [22, 23] with the labelled metallicities. Top-central panel: the case of a SFR constant from 13 Gyr ago to the present epoch. Top-left panel: the effect of adding a burst 10 times stronger in the last 20 Myr to the constant SFR. The CMD has a much brighter and thicker blue plume. Top-right panel: same constant SFR as in the first case, but with a quiescence interval between 3 and 2 Gyrs ago; a gap appears in the CMD region corresponding to stars 2-3 Gyr old, which are completely missing. Bottom-central panel: SF activity only between 13 and 10 Gyr ago with Z = 0.004. Bottom-right panel: SF activity only between 13 and 10 Gyr ago with Z = 0.0004: notice how colour and luminosity of turnoff, subgiant and red giant branches differ from the previous case. Bottom-left panel: SF activity between 13 and 11 Gyr ago, followed by a second episode of activity between 5 and 4 Gyr ago: a gap separates the two populations in the CMD, but less evident than in the top-right panel case, when the quiescent interval was more recent. |
The six panels of Fig. 1 illustrate the effect of different SFHs on the synthetic CMD of a hypothetical galactic region with number of resolved individual stars, photometric errors, blending and incompleteness factors typical of a region in the SMC imaged with HST/WFPC2. The top three panels show examples of CMDs typical of late-type galaxies, with ongoing or recent star formation activity. If the SFR has been constant for all the galaxy lifetime, the CMD of the region is expected to have the morphology of the top-central panel, with a prominent blue plume mostly populated by main-sequence (MS) stars and an equally prominent red plume resulting from the overposition of increasingly bright and massive stars in the red giant branch (RGB), asymptotic giant branch (AGB) and red supergiant phases. At intermediate colours, for decreasing brightness, stars in the blue loops, red clump and subgiant phases are visible, as well stars at the oldest MS turnoff (MSTO) and on the faint MS of low mass stars. Stars of all ages are present, from those as old as the Hubble time to the brightest ones a few tens Myr old.
If we leave the SFH unchanged except for the addition of a burst ten times stronger concentrated in the last 20 Myr, the CMD (top-left panel) has a much brighter and more populated blue plume, now containing many stars a few Myr old. In the top-right panel the same constant SFR as in the first case is assumed, but with a quiescent interval between 3 and 2 Gyrs ago: a gap is clearly visible in the CMD region corresponding to isochrones with the age of the missing stars.
The three bottom panels of Fig. 1 show CMDs typical of early-type galaxies, whose SF activity is concentrated at earlier epochs. If only one SF episode has occurred from 13 to 10 Gyr ago, with a constant metallicity Z = 0.004 as in the top-panel cases, the resulting CMD is shown in the bottom-central panel. If the SF has occurred at the same epoch, but with a metallicity ten times lower, the evolutionary phases in the resulting CMD (bottom-right panel) have colours and luminosities quite different from the previous case. Finally, the bottom-left panel shows the case of two bursts, the first from 13 to 11 Gyr ago and the second from 5 to 4 Gyr ago. The gap corresponding to the quiescent interval is visible in the CMD, although not as much as the more recent gap of the top-right panel.
Once a synthetic CMD is built, the challenging part of the method is the comparison with the observational CMD. The best values of the parameters (IMF, AMR, SFR, binary fraction, reddening and distance modulus) are found by selecting the cases providing synthetic CMDs with morphology, colours, number of stars in the various evolutionary phases and luminosity functions consistent with the observed ones. Independently of the specific method, any approach is unavoidably statistical and does not provide a unique solution for the SFH of the examined region. Nevertheless, the synthetic CMD method is quite powerful, thanks to the wealth of independent constraints available in a good CMD, and it strongly reduces the range of possible scenarios.
In the following, we will describe what are the major uncertainties in the method. Before diving into details, however, it is crucial to understand which parts of a CMD are the most reliable clocks.
What can be learnt from a CMD? All the evolutionary sequences are witness of the same SFH, but some sequences are specifically sensitive to age more than to any other ingredient (e.g. metallicity, convection, etc..). In order to track the history of a galaxy, it is necessary to select the safest age indicators. Because different evolutionary phases populate different CMD regions, one must then know which parts of the CMD are more informative.
The best indicators share a useful feature: the age is related to the
luminosity, which depends on the burning rate and on the available
fuel. The MS is the archetype of this class of phases, since in this
stage the stars obey a mass-luminosity relation L
 Mn (where n varies from 3 to 4). This relationship has
strong implications. Adopting a mean value n = 3.5 and considering
that the available fuel is proportional to the stellar mass M, the time
spent in MS is proportional to M-2.5: massive stars
live for short times (50 Myr for a 8
M
Mn (where n varies from 3 to 4). This relationship has
strong implications. Adopting a mean value n = 3.5 and considering
that the available fuel is proportional to the stellar mass M, the time
spent in MS is proportional to M-2.5: massive stars
live for short times (50 Myr for a 8
M ),
mapping only the recent SFH, while objects smaller than
1.5 M
can survive for many Gyr, mapping
the recent as well as the ancient star formation history. From the point
of view of the CMD, this one-to-one correspondence of luminosity and
mass/age allows, for a given metallicity, a direct conversion of the MS
information into the SFH.
),
mapping only the recent SFH, while objects smaller than
1.5 M
can survive for many Gyr, mapping
the recent as well as the ancient star formation history. From the point
of view of the CMD, this one-to-one correspondence of luminosity and
mass/age allows, for a given metallicity, a direct conversion of the MS
information into the SFH.
Beyond the MS a mass-luminosity relation does not hold anymore, and the
luminosity is rather sensitive to the core mass growth. The phases
between the MS and the red giant are so fast (thermodynamical evolution)
that the probability of observing their stars is low (compared to that
for nuclear phases). This causes the so-called Hertzsprung gap, i.e. the
observed lack (or paucity) of stars in the evolutionary phase right
after the MS. However, for stars smaller than about 2-2.5
M, the
evolutionary times are long enough
(because the degeneracy pressure prevents a rapid core contraction) to
define another useful age indicator: the sub-giant branch
(SGB). Like the MS turn-off, the SGB fades as the the age increases.
Later evolutionary phases, namely the RGB, the horizontal branch (HB), the red clump (RC) and the asymptotic giant branch, with the exception of the blue loop (BL) stage, are questionable age indicators. In fact, the CMD position of such objects mostly reveals the age through the color, which can be influenced by several factors. As an example, aging the stars makes the RGB redder, but theoretical uncertainties like the color transformations and the super-adiabatic convection can lead to higher color shifts. The RGB is undoubtedly more sensitive to the metallicity. On the other hand, all these phases are indisputable signature of stars older than a limiting age and extremely useful in the age dating of galaxies too distant to have the MSTO reachable by any photometry: HB stars are always older than 10 Gyr, RGBs at least 1-2 Gyr old, and AGBs older than 100 Myr. Moreover, as thoroughly discussed by Greggio [24], the relations existing between the number counts of post-MS stars and their mass helps in constraining the SFH.
Among core helium burning stars, the HB and the RC phases are composed
by stars of initial mass smaller than about 2 solar masses, whose
luminosity depends on the helium core mass and is quite independent of
the stellar mass. In particular, the HB color frequently shows a
correlation with metallicity (the "first parameter"), while
age is only one of the possible secondary parameters. Quite different is
the behavior of intermediate mass stars (over 2
M):
during the core helium burning these
objects describe a large loop in color (the so-called blue loops) and
their luminosities are critically sensitive to the mass; this is because
the core mass is connected to the extension of the convective cores in
the previous MS structures. Thanks to this feature, for ages of 100-500
Myr, the luminosity of the loops fades with age and the BL is an
excellent age indicator.
After the core helium burning phase, low and intermediate mass stars experience the AGB phase. As for the RGB, a relation between the luminosity and the core mass holds. In addition, many phenomena occur (e.g. mixing and extra mixing of convective layers, thermal pulses, etc.) which are not yet understood in detail, and this leaves considerable uncertainty.
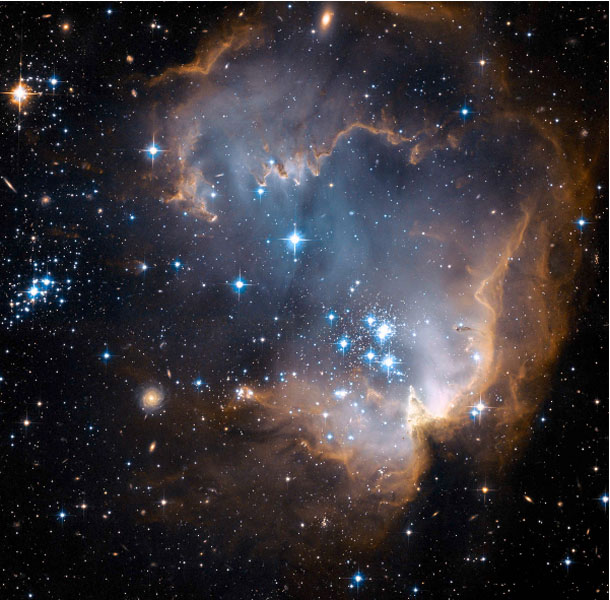
The very first and the final stages of stellar evolution, namely the pre-main sequence (PMS) and the white dwarf (WD) regimes also deserve some comments. As for the former, prior to reaching the MS, the star's energy source is a contraction on thermodynamical timescales (tenths of Myr). While aging, pre-main sequence stars fade and become hotter. Figure 2 shows the HST/ACS images and the corresponding CMDs of two star forming regions in the Small Magellanic Cloud, NGC602 (left-hand panels, [25]) and NGC346 (right-hand panels, [26]). The well-defined sequence well separated from the canonical main sequence, which appears on the right-hand side of these CMDs, is composed by PMS stars.
 |
 |
 |
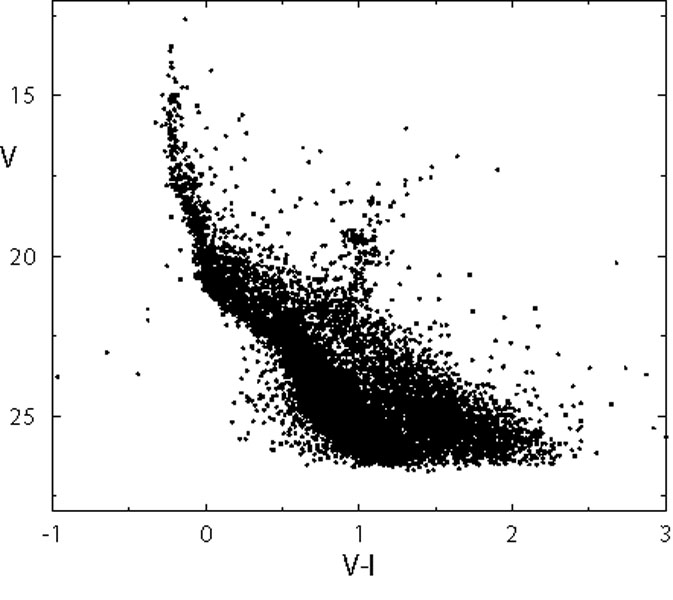 |
Figure 2. Top panels: HST/ACS true color images of NGC602 (left), a very young cluster in the wing of the SMC and NGC346 (right), a populous young cluster in the main body of the SMC. Images credit NASA, ESA and A. Nota (STScI, ESA). Bottom panels: CMD of NGC602 (left panel) and of NGC346 (right panel). PMS stars are clearly visible at the right of the Main Sequence. |
|
Were not this phase affected by several theoretical and observational uncertainties, the PMS would be a powerful clock for the most recent Myrs (see e.g. [27] and references therein).
On the other hand, WDs represent the final fate of all stars with masses
below 8 M.
These stars share a useful feature: the peak of
the WD luminosity function fades with age. Unfortunately, the presence
of theoretical uncertainties (e.g. crystallization processes, nuclear
reaction
rates, convection, mass loss, and initial chemical composition)
together with an intrinsic low luminosity (10 < MV
< 18) tend to invalidate its reliability.
In conclusion, MS and SGB stars are certainly the most reliable age indicators. If we add that in these phases faint objects live longer, a deeper CMD gives a better chance to robustly trace the past star formation history. It is important to underline that quantitative and qualitative indicators can be combined and typically complement each other. In other words, when a deep CMD is not available, evolved stars can be used very profitably to recover the SFH, although with higher uncertainty and within shorter lookback times.
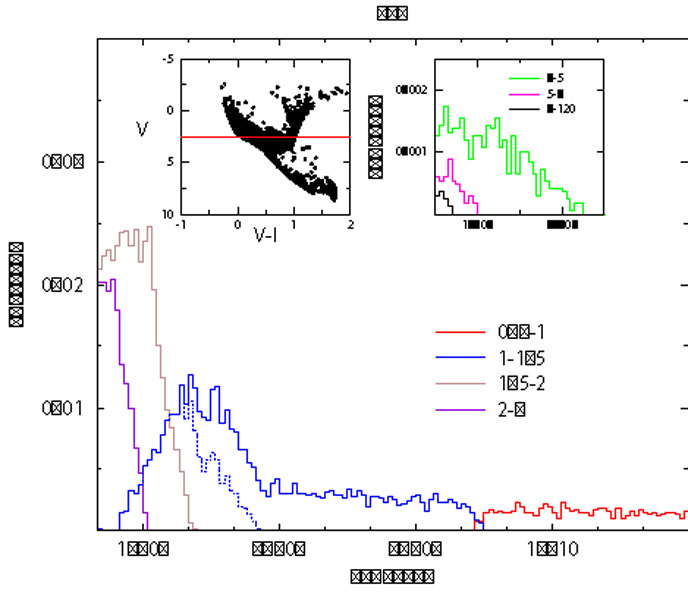
The presence of a completeness limit (due to both the intrinsic crowding and distance of the examined galaxy and to the instrumental capabilities) hinders the possibility to exploit all the information contained in a CMD. To visualize this effect, we built age-frequency plots for various stellar mass ranges, assuming different completeness limits (see Figures 3) and using an artificial population generated from the Padova stellar models [22] with Z = 0.004, no binaries, and constant SFR. In order to be as general as possible, all the results are shown using absolute magnitudes. In all panels of Fig. 3 we plot with different colors the fraction of stars of various mass ranges visible in the CMD above the assumed completeness limit as a function of their age.
In Figure 3a the completeness limit is set to
MV = 2.5: we see that on the MS only stellar masses
higher than
1.5 M
are brighter than this limit and usable witnesses of
the last 2 Gyr. On the other hand, the long-lived nature of lower
masses guarantees to trace long periods of star formation, but not
the recent SFR. The explanation comes from the limit
MV = 2.5 itself: it cuts off the MS, so for stars
below 1.5
M we
see only later (i.e. brighter) evolutionary phases, represented by
the RGB and the central helium burning (the dotted lines for the mass
ranges 0.6-1.0
M and
1.0-1.5
M
represent the contribution of PMS, MS and SGB stars).
 |
 |
 |
 |
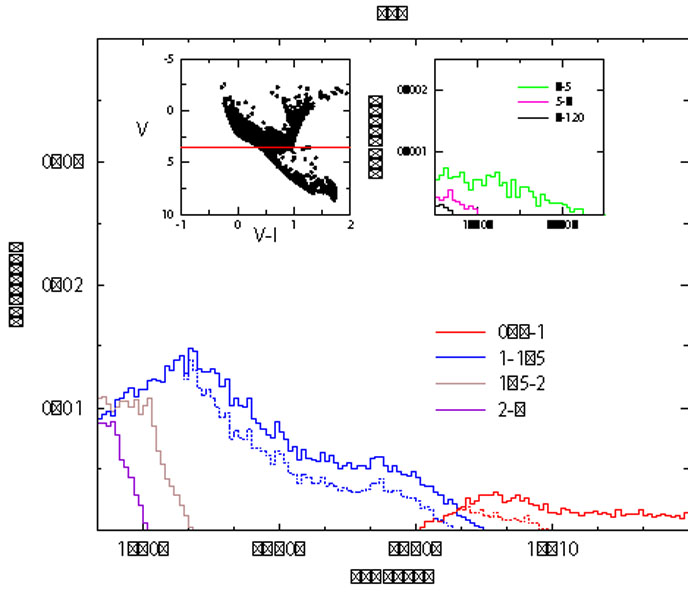
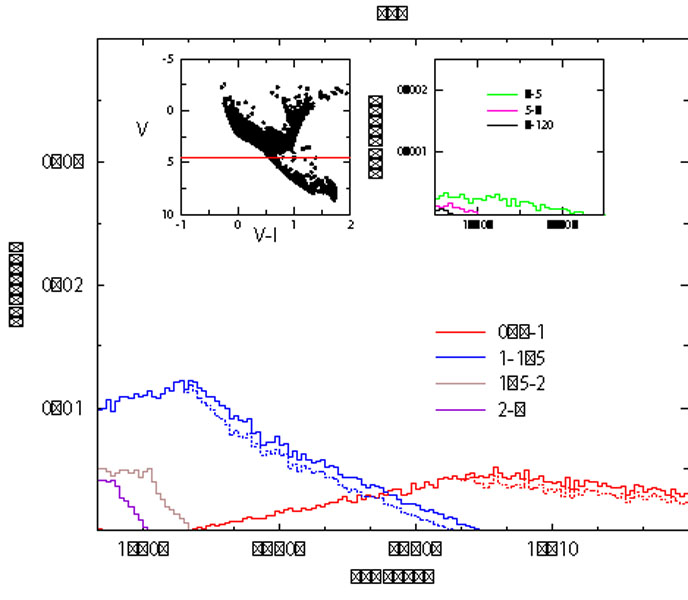
Figure 3. Fractional age distributions of stars generated with a constant SFR (0-13 Gyr) for four different completeness limits. In different colors (solid lines) are plotted the contributions from different mass ranges. In panel (a) only stars with absolute magnitude brighter than 2.5 are plotted, while in panels (b), (c) and (d) this limit is respectively MV = 3.5, MV = 4.5 and MV = 5.5. The dotted lines represent the contribution of PMS, MS, SGB. In each panel, the left and right sub-figures show respectively the adopted simulated population (with the limiting magnitude marked by a red line) and a blow-up with the contribution of intermediate and massive stars in the last 300 Myr. |
|
Moving the limit to V = 3.5 (Figure 3b),
the mass interval
1-1.5 M
is visible in the CMD and informative of the star
formation history between now and ~ 8 Gyr ago. However, only
masses over 1.2-1.3
M are on
the MS. Lower masses or,
equivalently, older epochs, must refer to RGB and He burning
phases. The situation improves when the completeness limit is set at
MV = 4.5 (3c), and the MS
phase is visible for all stars down to ~ 0.8
M. This
limit represents a very
good level for studying the history of a resolved galaxy, since it
guarantees age sensitive tracers (MS and SGB stars) covering the
entire Hubble time (13 Gyr).
Finally, Figure 3d shows the age plots for a completeness limit MV = 5.5: at this luminosity, the zero age main sequence is reached for sub-solar masses, whose lifetimes are longer than the age of the Universe. With respect to the MV = 4.5 case, the advantages here are: 1) a much more reliable photometry of the turn-off and SGB stars; 2) further information on the IMF, thanks to a better coverage of the lowest/faintest mass intervals, where the IMF slope may significantly change (e.g. [28, 29] and references therein); 3) a better constraint on Z(t), given the mild influence of the SF law on the CMD position of low mass stars.
These results depend on the assumed chemical composition. This is
important when one considers that in galaxies some chemical enrichment
must always be at work. Following this paradigm, the oldest stars in a
galaxy are expected to be metal poor. Changing the metallicity has two
main effects on the model; namely, changes in the evolutionary
lifetimes and changes in the stellar luminosity, which in turn can
sensibly modify the relation between CMD and SFH. To investigate this
phenomenon, in Figure 4 the frequency-age plot
for the
completeness limit MV = 4.5 is shown for two different
metallicities, Z = 0.004 (thick lines in the figure) and Z = 0.0004 (thin
lines). Lowering the metallicity accelerates the evolution, and the
age distribution for all the mass intervals (except
0.6-1 M)
is shifted by, at least, 1 Gyr with
respect to the Z = 0.004 cases. The age plot for masses 0.6-1
M has a
different genesis: part of these stars live more than 13 Gyr, so the
evolutionary effect is not visible. In contrast, the mass range
0.6-1 M
emphasizes the luminosity effect: a lower
metallicity pushes MS stars over the completeness limit
MV = 4.5,
injecting younger stars in the age distribution, that now involves
ages between 0 and 13 Gyr. In practice, a lower metallicity mimics
what happens with a more favorable completeness limit.
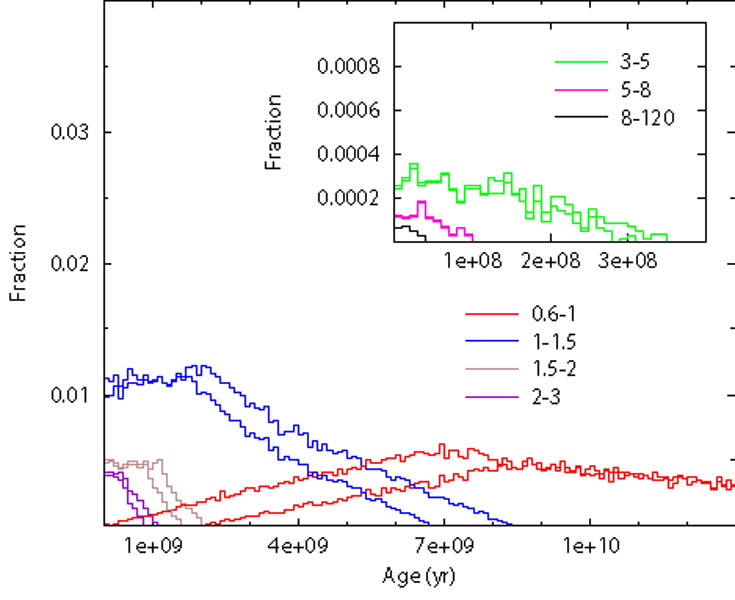 |
Figure 4. Fractional age distributions for stars brighter than MV = 4.5 at two different metallicities. The thick line represents Z = 0.004, while the thin line represents Z = 0.0004. |
This implies the following rule: in order to safely use the CMD for an estimate of the oldest star formation history we need to resolve all the stars down to MV = 4.5. Since this magnitude can be reached only in the closest galaxies, this implies that in most cases the information on the earliest SF activity is either completely lacking or very uncertain.
