


The hierarchy of star formation begins on the scale of Jeans-mass cloud complexes. Giant molecular clouds (GMCs) form by molecular line shielding and condensation inside these giant clouds, and star complexes build up from the combined star formation (Elmegreen & Elmegreen 1983). Each GMC makes a single OB association at any one time. Hierarchical structure has been known to be important in star-forming regions for a long time (e.g., Larson 1981, Feitzinger & Galinski 1987). Early reviews of large-scale hierarchical structure are in Scalo (1985, 1990). Interstellar hierarchies have also been thought to have a possible role in the stellar initial mass function (e.g., Larson 1973, 1982, 1991).
The nearby galaxy M33 has a clear pattern of giant HI clouds, with
masses of 106 - 107
M ,
containing most of the GMCs and CO emission
(Engargiola
et al. 2003).
Giant star complexes occur in these regions
(Ivanov 2005),
often extending beyond the HI clouds because
of stellar drift. The high-definition image of M51 made by the ACS
camera on the Hubble Space Telescope shows exquisite examples of
stellar clustering on a wide variety of scales, with similar patterns
of clustering for dust clouds, which are the GMCs
(Fig. 1).
Clearly present are giant clouds (1 kpc large with M ~ 107
M) that
are condensations in spiral arm dust lanes,
star formation inside these clouds with no noticeable time delay after
the spiral shock, and scattered star formation downstream. The
downstream activity has the form of lingering star formation in cloud
pieces that come from the disassembly of spiral arm clouds, in addition
to triggered star formation in shells and comet-shaped clouds that are
also made from the debris of spiral arm clouds (see Lectures 2 and 4).
,
containing most of the GMCs and CO emission
(Engargiola
et al. 2003).
Giant star complexes occur in these regions
(Ivanov 2005),
often extending beyond the HI clouds because
of stellar drift. The high-definition image of M51 made by the ACS
camera on the Hubble Space Telescope shows exquisite examples of
stellar clustering on a wide variety of scales, with similar patterns
of clustering for dust clouds, which are the GMCs
(Fig. 1).
Clearly present are giant clouds (1 kpc large with M ~ 107
M) that
are condensations in spiral arm dust lanes,
star formation inside these clouds with no noticeable time delay after
the spiral shock, and scattered star formation downstream. The
downstream activity has the form of lingering star formation in cloud
pieces that come from the disassembly of spiral arm clouds, in addition
to triggered star formation in shells and comet-shaped clouds that are
also made from the debris of spiral arm clouds (see Lectures 2 and 4).
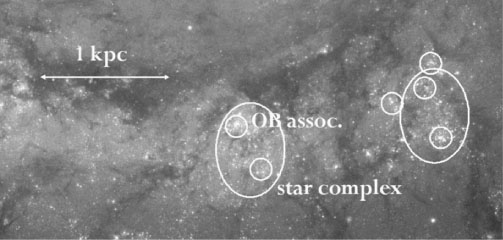 |
Figure 1. The Southern part of the inner
spiral arm of M51, showing star
formation on a variety of scales, with OB associations inside star
complexes and gas structures all around. The dust lane is broken up
into giant cloud complexes that contain 107
M |
Star clusters in M51 observed with HST have been studied by Scheepmaker et al. (2009). The overall distribution of clusters in the M51 disk shows no obvious correlations or structures, aside from spiral arms. But autocorrelation functions for three separate age bins show that the youngest sample is well correlated: it is hierarchical with a fractal dimension of ~ 1.6. This means that there are clusters inside cluster pairs and triplets, that are inside clusters complexes and so on, up to ~ 1 kpc. Clusters in the Antennae galaxy are also auto-correlated out to ~ 1 kpc scales (Zhang, Fall, & Whitmore 2001).
Sánchez & Alfaro (2008) surveyed the positions of HII regions in several galaxies. They found that the fractal dimension, Dc, of the distribution of HII regions decreases with increasing HII region brightness. For NGC 6946, Dc = 1.64 for high-brightness HII regions, Dc = 1.82 for medium-brightness, and Dc = 1.79 for low-brightness. They also found that among galaxies with more than 200 HII regions, the fractal dimension decreases slightly with decreasing galaxy brightness.
The fractal dimension is the ratio of the log of the number N of substructures in a region to the log of the relative size S of these substructures. If we imagine a square divided into 3 × 3 subsquares, which are each divided into 3 × 3 more subsquares, and so on, then the size ratio is S = 3 for each level. If 6 of these subsquares actually contain an object like an HII region (so the angular filling factor is 6/9), then N = 6 and the fractal dimension is log6 / log3 = 1.63. If all 9 regions contain substructure, then the fractal dimension would be log9 / log3 = 2, which is the physical dimension of the region, viewed in a 2-dimensional projection on the sky. Thus a low fractal dimension means a small filling factor for each substructure in a hierarchy of substructures. If the brightest HII regions have the smallest fractal dimension in a galaxy, then this means that the brightest HII regions are more clustered together into a smaller fraction of the projected area. This greater clustering is also evident from maps of the HII region positions as a function of brightness (Sánchez & Alfaro 2008). The brightest HII regions tend to be clustered tightly around the spiral arms. Similarly, fainter galaxies have more tightly clustered HII regions than brighter galaxies.
The size distributions of star-forming regions can also be found by
box-counting.
Elmegreen et
al. (2006)
blurred an HST/ACS image of the galaxy
NGC 628 in successive stages and counted all of the
optical sources at each
stage with the software package SExtractor. The cumulative size
distribution of structures, which are mostly star-forming regions, was
a power law with power 2.5 for all available passbands, B, V, and I,
i.e., n(> R)dR
 R-2.5 dR for size R. The
H
R-2.5 dR for size R. The
H band had
a slightly shallower power. They compared this distribution with the
distribution of structures in a projected 3D model galaxy made as a
fractal Brownian motion density field. They got good agreement when the
power spectrum for the model equalled the 3D power spectrum of
Kolmogorov turbulence, which has a slope of 3.66. Other power spectra
gave either too little clumpiness of the structures (lower n[>
R] slope) or too much clumpiness (higher slope).
band had
a slightly shallower power. They compared this distribution with the
distribution of structures in a projected 3D model galaxy made as a
fractal Brownian motion density field. They got good agreement when the
power spectrum for the model equalled the 3D power spectrum of
Kolmogorov turbulence, which has a slope of 3.66. Other power spectra
gave either too little clumpiness of the structures (lower n[>
R] slope) or too much clumpiness (higher slope).
Azimuthal intensity profiles of optical light from galaxies have power-law power spectra like turbulence too. Elmegreen et al. (2003) showed that young stars and dust clouds in NGC 5055 and M81 have the same scale-free distribution as HI gas in the LMC (Elmegreen et al. 2001), both of which have a Kolmogorov power spectrum of structure. For azimuthal scans, the power spectrum slope was ~ -5/3 in all of these cases. Block et al. (2009) made power spectra of Spitzer images of galaxies. They included M33, which is patchy at 8 µm where PAH emission dominates, and relatively smooth at 3.6 µm and 4.5 µm where the old stellar structure dominates. The power spectra showed this difference too: the slopes were the same as those of pure noise power spectra for the stellar images, and about the same as Kolmogorov turbulence for the PAH images. The grand-design galaxy M81 had the same pattern. Block et al. also reconstructed images of the galaxies over the range of Fourier components that gave the power-law power spectrum. These images highlight the resolved hierarchical parts of the galaxies. These parts are primarily star complexes and young stellar streams.
The central regions of some galaxies show highly structured dust clouds in HST images. The central disk in the ACS image of M51 shows this, for example. In the central regions of these galaxies, there are large shear rates, strong tidal-forces, sub-threshold column densities, strong radiation fields, and lots of holes and filaments in the dust. The origin of the holes is not known, although it is probably a combination of radiation pressure, stellar winds, and turbulence. Irregular dust in the center of NGC 4736 was studied by Elmegreen et al. (2002) using two techniques. One used unsharp mask images, which are differences between two smoothed images made with different Gaussian smoothing functions. Unsharp masked images show structure within the range of scales given by the smoothing functions. They also made power spectra of azimuthal scans. The power spectra were found to be power laws with a slope of around -5/3, the same as the slope for HI in the LMC and optical emission in NGC 5055 and M81. A possible explanation for the power-law dust structure in galactic nuclei is that this is a network of turbulent acoustic waves that have steepened into shocks as they move toward the center (Montengero et al. 1999).
Block et al. (2010) made power spectra of the Spitzer images of the Large Magellanic Cloud at 160 µ, 70 µ, and 24 µ (see Figure 2). Again the power spectra are power laws, but now the power laws have breaks in the middle, as found previously in HI images of the LMC (Elmegreen et al. 2001). These breaks appear to occur at a wavenumber that is comparable to the inverse of the disk line-of-sight thickness. On scales smaller than the break, the turbulence is 3D and has the steep power spectrum expected for 3D, and on larger scales the turbulence is 2D and has the expected shallower spectrum. The LMC is close enough that each part of the power spectrum spans nearly two orders of magnitude in scale. The slopes get shallower as the wavelength of the observation decreases, so there is more small-scale structure in the hotter dust emission.
 |
Figure 2. (Left) An image of the LMC at 24 µm from the Spitzer Space Telescope. (Right) The 2D power spectrum of this image, showing two power-law regions. The region with high slope at large spatial frequency k is presumably 3D turbulence inside the thickness of the disk, and the region with low slope at small k is presumably from 2D turbulence and other motions on larger scales. The break in the slope defines the scale of the disk thickness (from Block et al. 2010). |
Power-law power spectra in HI emission from several other galaxies were
studied by Dutta and collaborators.
Dutta et al. (2008)
obtained a power spectrum slope of -1.7 covering a factor of 10 in scale
for NGC 628.
Dutta et
al. (2009a)
found two slopes in NGC 1058 with a steepening from -1
to -2.5 at an extrapolated disk thickness of 490 pc (although their
spatial resolution did not resolve this length).
H and HI power
spectra of dwarf galaxies showed single power laws
(Willett et
al. 2005,
Begum et al. 2006,
Dutta et
al. 2009b),
as did the HI emission
(Stanimirovic
et al. 1999)
and dust emission
(Stanimirovic
et al. 2000)
of the Small Magellanic Cloud. The SMC has an interesting contrast to
the LMC,
both of which are close enough to make a power spectrum over a wide
range of spatial scales. The LMC has a two component power spectrum,
but the SMC has only a single power-law slope. The
difference could be because the line-of-sight depth is about as long as
the transverse size for the SMC, while the line-of-sight depth is much smaller
than the transverse size for the LMC.