Copyright © 2009 by Annual Reviews. All rights reserved
| Annu. Rev. Astron. Astrophys. 2009. 47:
371-425 Copyright © 2009 by Annual Reviews. All rights reserved |


The field of resolved stellar population studies was initiated by
W. Baade in the 1940s when he first resolved dwarf
satellites of M 31 into individual stars and from their color
distribution he realised that they were a different "population"
from what is typically seen in our Galaxy
(Baade 1944a,
b).
These were simplified using the terms Population I for young stars and
Population II for old stars. Thus the importance of determining
accurate star formation histories (SFHs) of dwarf galaxies was
recognized long ago and over the years many different approaches have
been followed. The earliest quantitative results came from the
determination by
Searle, Sargent
& Bagnuolo (1973)
of how the color of the integrated
light of different galaxy types reflected their SFH. This work was
extended and improved upon in an extensive series of papers by
Gallagher, Hunter and collaborators starting in the early 1980s, (e.g.,
Gallagher,
Hunter & Tutukov 1984,
Hunter &
Gallagher 1986
and references therein). They
used various different indicators (e.g., colors and spectrophotometry,
H luminosity, and
emission line ratios) to estimate the star formation
rates (SFRs) at different epochs for large samples of late-type
irregular galaxies, including dwarfs.
luminosity, and
emission line ratios) to estimate the star formation
rates (SFRs) at different epochs for large samples of late-type
irregular galaxies, including dwarfs.
The transformation in this field occurred around 15 years ago, when the power and resolution of a new generation of telescopes (particularly the Hubble Space Telescope, HST) and detectors (large format CCDs) allowed accurate photometry and thus detailed Color-Magnitude Diagrams (CMDs) of individual stars in crowded fields of external galaxies to be made. The CMD of a stellar system retains information about the past SFH, as it preserves the imprint of fundamental evolutionary parameters such as age, metallicity and Initial Mass Function (IMF) in such a way that it is possible to disentangle them.
2.1. Techniques: Synthetic CMD analysis
At the beginning of last century, stars were found to group themselves in temperature-luminosity ranges (observed as color and magnitude), in the Hertzsprung-Russell Diagram; and it was later understood that the positions of stars in a CMD represent the evolutionary sequences of stellar populations. Since the 1950s large numbers of detailed CMDs have been derived for star clusters and nearby dwarf galaxies (e.g., Hodge 1971 and references therein). However it was not until the advent of modern CCDs and analysis techniques of the early 1980s that the field really took off for complex galactic systems, like dwarf galaxies.
Until about twenty years ago all stellar age dating used isochrone fitting, which is appropriate for simple stellar populations such as star clusters, but a serious over-simplification for the interpretation of the composite stellar populations of galaxies. In galaxies numerous generations of stars, with different metallicities and ages contribute to the appearance of the observed CMD. Thus a new approach was needed to make the most of the new and accurate CMDs, a method to determine a quantitative SFH: the synthetic CMD method.
The synthetic CMD method determines the variation of the SFR within the look-back time reached by the available photometry, namely the SFH. It is based on comparing observed with theoretical CMDs created via Monte-Carlo based extractions from stellar evolution tracks, or isochrones, for a variety of star formation laws, IMFs, binary fractions, age-metallicity relations, etc. Photometric errors, incompleteness and stellar crowding factors also have to be estimated and included in the procedure to fully reproduce an observed CMD (e.g., Tosi et al. 1991, Aparicio et al. 1996, Tolstoy 1996, Dolphin 1997). A combination of assumed parameters is acceptable only if the resulting synthetic CMD satisfactorily reproduces all the main features of the observational one. This means morphology, luminosity, color distribution, and number of stars in specific evolutionary phases. Different authors use different approaches to assess the quality of the fit, typically using a form of likelihood analysis comparing the model and the data within the uncertainties of the measurement errors. The method is intrinsically statistical in nature and cannot provide a unique solution for the SFH for a number of reasons, but it usefully limits the range of possible scenarios (e.g., Tolstoy & Saha 1996, Hernandez, Gilmore & Valls-Gabaud 2000, Dolphin 2002, Aparicio & Gallart 2004). The theoretical uncertainties in the stellar evolution models also influence the numerical results and have to be treated carefully (see Gallart, Zoccali & Aparicio 2005 for a review).
2.1.1 AN EXAMPLE: Fig 2 shows examples of how CMDs reflect different SFHs in a hypothetical galaxy. Here we have assumed a distance modulus of (m - M)0 = 19, reddening E(B - V) = 0.08 and photometric errors and incompleteness typical of HST photometry with the Wide Field Planetary Camera 2 (WFPC2). Thus these CMDs could apply to a typical SMC field observed with the WFPC2. In all panels the number of stars and the IMF are the same, and what changes from panel to panel is the metallicity and the SFH. In the top panels all stellar evolution phases are visible: the blue plume typical of late-type galaxies, populated by massive and intermediate-mass stars on the main-sequence, and in the most metal poor case also by brighter blue loop stars; the red clump and blue loops of stars in the core helium burning phase; the Asymptotic Giant Branch (AGB) and RGB; the sub-giant branch; the oldest MSTOs and the main-sequence of the lower mass stars. In the lower panels of Fig. 2 we see a much simpler old SFH. On the left is the effect of a burst on top of this old population, and on the right a different metallicity. Fig. 2 (the top panels in particular) emphasizes the challenge in interpreting real CMDs: observed data points don't have convenient labels indicating their age and metallicity, and unraveling different sub-populations overlying each other is challenging.
 |
Figure 2. The effect on the CMD of different SFHs for a hypothetical galaxy (see text for more details). All CMDs contain 50000 stars, assume Salpeter's IMF and are based on the Padova stellar evolution models (Fagotto et al. 1994a, b). A constant metallicity is assumed, and the value is indicated in the top-right corner of each panel. In all panels the colors correspond to different stellar ages. The color codes for the top and bottom CMDs are shown in the central panel of each row. The dotted lines are drawn to help visualise the differences between the various cases. Top-central panel: the SFR is constant from 13 Gyr ago to the present. Top-left panel: the effect of concentrating recent SFR into the last 20 Myr. Top-right panel: the same SFH as in the top-central panel, but with a ten times lower metallicity. Bottom-central panel: an old burst of star formation overlying a constant SFR from 13 to 10 Gyr ago. Bottom-left panel: two old bursts, one with a constant SFR from 13 to 10 Gyr ago and the other from 9 to 8 Gyr ago, where only 10% of the stars were born in the younger burst. Bottom-right panel: the same old SFH as in the bottom-central panel, but with a ten times lower metallicity. |
One important issue in the derivation of the SFH from a CMD is the metallicity variation of the stellar population. If no spectroscopic abundance information is available (which is unfortunately frequently the case), the metallicity is assumed to be that of the stellar evolution models with colors and CMD morphology in best agreement with the empirical CMD. This is often a particularly uncertain assumption because some of the key evolutionary sequences in the CMD can be heavily affected by age-metallicity degeneracy. For instance, metal-rich RGB stars from a relatively young (a few Gyrs old) population can occupy the same region in a CMD as a more metal-poor, but older population. Without a spectroscopic estimate of the metallicity, it is impossible to break this degeneracy, unless the MSTOs are also observed. This is often not the case and one has to deal with the inevitable uncertainty. A further aspect of the effect of metallicity is related to the rather coarse grids of different initial chemical compositions that stellar evolution models are actually computed for. Despite the commendable efforts by stellar evolution modellers, complete sets of homogeneous models covering the entire stellar mass range are limited to a few key metallicities (e.g., Z = 0.02, 0.008, 0.004, 0.0004, 0.00004). Thus synthetic CMDs assuming a smoothly varying age-metallicity relation have to be created by interpolating between the available metallicities, and this adds to the uncertainty in the derived SFH.
2.1.2 TESTING THE RELIABILITY: In 2001 the different procedures to statistically determine SFHs from about 10 groups, using a variety of different assumptions and stellar evolution models, were compared in the Coimbra Experiment (see Skillman & Gallart 2002, and references therein). This experiment showed that, despite all the different assumptions, modelling procedures and even stellar evolution models, most synthesis methods provided consistent results within their uncertainties. This was again shown in the HST/WFPC2 study of the dI IC 1613 (Skillman et al. 2003) where a synthetic CMD analysis was carried out independently by 3 different people (representing 3 independent modelling approaches) and again the results were reassuringly similar (see Fig. 3). These WFPC2 data, however, did not reach the oldest MSTOs in IC 1613 and the SFH at the earliest epochs therefore remained uncertain with these data. More recent deep observations with the HST/ACS, as part of the LCID project (Gallart & The Lcid Team 2007), do reach the faint oldest MSTOs in IC 1613, but in a different field. Interestingly its CMD is quite different from that of Skillman et al. (2003), as it lacks the dominant younger component and it is reproduced by an almost constant SFR with time. This new LCID ACS field is situated at a galacto-centric radius similar to that of the WFPC2 CMD, but, by their nature, irregular galaxies are often asymmetric and these differences are not surprising. This reminds us of the dangers of looking at a small fraction of these complex systems.
 |
Figure 3. Comparison of SFHs for dI IC 1613 derived via three different methods (Cole, Dolphin & Tolstoy), from Skillman et al. (2003). Note the enhanced levels of SFR between 3 and 6 Gyr ago which appear in all three models. Also shown are the age-metallicity relations which were derived in each case. |
With a sufficient investment in telescope time we can resolve individual stars down to the oldest MSTOs in all the galaxies of the Local Group, and use the resulting CMDs to infer their SFHs over the entire Hubble time. This kind of analysis has been obtained for only a handful of galaxies to-date. If the oldest MSTOs are not reached, then the look-back time depends on which features of the CMD can be resolved: Horizontal Branch (HB) stars are > 10 Gyr old but hard to interpret in terms of a SFH, except to say that there are ancient stars. RGB stars are at least 1-2 Gyr old, but without further information it is impossible to be quantitative about the SFH because of the age-metallicity degeneracy. Of course younger populations are much brighter and obtaining the SFH over the last Gyr, especially in actively star-forming galaxies, is possible even well beyond the Local Group.
2.2. Observations: Dwarf Galaxies in the Local Group
In spite of all the uncertainties, and perhaps because most of them are well treated in a Monte-Carlo approach, the first applications of the synthetic CMD method immediately showed the powerful capability to provide detailed new perspectives (e.g., Ferraro et al. 1989, Tosi et al. 1991, Greggio et al. 1993, Marconi et al. 1995, Gallart et al. 1996, Tolstoy 1996). These early studies found that the SFH not only differs significantly from one galaxy to another, but also according to where one looks within the same galaxy. It was shown that star formation in late-type dwarfs usually occurs in long episodes of moderate intensity separated by short quiescent phases (gasping regime; (Marconi et al. 1995), rather than in short episodes of strong intensity separated by long intervals (bursting regime).
When WFPC2 became available after the first HST refurbishment at the end of 1993, it created a tremendous amount of interest and enthusiasm in the field of SFH research (e.g., see reviews, Tolstoy 2003, Dolphin et al. 2005 and references therein) because WFPC2 provided such accurate, well defined and deep CMDs. In 2002, the Advanced Camera for Surveys (ACS) on HST yet again improved the possibilities, reaching a photometric depth and resolution that is likely to remain unequalled for quite a long time (e.g., see review, Tosi 2007a and references therein).
To date, a significant fraction of Local Group galaxies have been studied using the synthetic CMD method to infer their SFH with varying degrees of depth and accuracy, see Tables 1 & 2. Many of the galaxies in these tables, and several not included, for which HST/WFPC2 data exist, have been compiled by Holtzman, Afonso & Dolphin (2006), and their SFH homogeneously derived by Dolphin et al. (2005). Homogeneous data sets and analyses are valuable to obtain a uniform overview of dwarf galaxy properties in the Local Group.
| Galaxy | D (kpc) | MVa | rh (')b | instrument (fov) | look-backc |  10
Myr 10
Myr |
1-8 Gyr |  10
Gyr 10
Gyr |
Spectroscopy | ||
| LRd | HRd | HII | |||||||||
| (1) | (2) | (3) | (4) | (5) | (6) | (7) | (8) | (9)e | (10) | (11) | (12) |
| WLM | 978±20 [1] | -14.6 | 5.5 | WFPC2 (160'') [2] | HB | √ | √ | √ | [3] | [4] | [5] |
| Sextans B | 1370±180 [6] | -14.2 | 3.9 | ESO/2.2m (2') [7] | RGB | √ | √ | ? | ... | ... | [8] |
| NGC 3109 | 1300±200 [9] | -15.8 | 13.3 | ESO/2.2m (2') [10] | RGB | √ | √ | ? | ... | [11] | [12] |
| NGC 6822 | 460±5 [13] | -15.1 | 40 | INT/WFC (23' × 11') [14] | RGB | √ | √ | ? | [15] | [16] | [17] |
| WFPC2 (160'' [18] | HB | √ | √ | RRL[19] | |||||||
| Leo A | 800±40 [20] | -11.7 | 3.9 | ACS (195") [21] | oMSTO | √ | √ | RRL[20] | [22] | ... | [23] |
| Sextans A | 1320±40 [24] | -14.5 | 4.0 | WFPC2 (160") [25] | HB | √ | √ | ? | ... | [26] | [8,27] |
| IC 1613 | 721±5 [28] | -14.6 | 11±3 | WFPC2 (160") [29] | MSTO | √ | √ | √ | ... | [30] | [31] |
| ACS (195") [32] | oMSTO | √ | √ | √ | |||||||
| SagDIG | 1050±50 [33] | -12.2 | 1.7 | ACS (195") [33] | HB | √ | √ | √ | ... | ... | [34] |
| Pegasus | 919±30 [35] | -12.8 | 3.9 | WFPC2 (160") [36] | RGB | √ | √ | ? | ... | ... | [37] |
| DDO 210f | 1071±39 [35] | -10.6 | 1.6 | Subaru (30')/VLT (7') [38] | HB | x | √ | √ | ... | ... | x |
| LGS 3f | 620±20 [39] | -9.9 | 14.5±4.5 | WFPC2 (160") [39] | HB | x | √ | √ | [40] | ... | x |
| ACS (195") [41] | oMSTO | x | √ | √ | |||||||
| Phoenixf | 406±13 [42] | -10.1 | > 8.6 | WFPC2 (160") [43] | HB | x | √ | √ | [44] | ... | x |
| Leo Tf | 400±40 [45] | -8.0 [45] | 1.4 [45] | LBT (23') [46] | HB | x | √ | ? | [47] | ... | ... |
| SMC | 59.7±2.2 [48] | -16.1 | 320 | WFPC2 (160") [49] | oMSTO | √ | √ | √ | [50] | [51] | [52] |
| LCO1m drift scan [53] | MSTO | √ | √ | √ | |||||||
| WFI (30') [54] | oMSTO | √ | √ | √ | |||||||
| ACS (195") [55] | oMSTO | √ | √ | √ | |||||||
| GR 8 | 2200±400 [56,57] | -12.3 [58] | 1.0 [58] | WFPC2 (160") [57] | RGB | √ | √ | ? | ... | ... | [59] |
| a From Mateo 1998, updated using new distances, except where otherwise indicated | |||||||||||
| b Holmberg limit, from, Mateo 1998, except where otherwise indicated | |||||||||||
| c faintest main features visible in the CMD: red giant branch (RGB), Horizontal Branch (HB), Main Sequence Turnoffs > 2 Gyr old (MSTO), oldest Main Sequence Turnoffs (oMSTO) | |||||||||||
| d individual RGB stars | |||||||||||
| e If the CMD is ambiguous as to the presence of an HB, but the presence of ancient stars has been confirmed by the measurement of RR~Lyr variable stars, this is noted. A question mark signifies that there is not enough information to determine whether or not an ancient population is present | |||||||||||
| f transition types, gas but no star formation | |||||||||||
| [1] Gieren et al. (2008); [2] Dolphin (2000); [3] Leaman et al. (2009); [4] Urbaneja et al. (2008); Venn et al. (2003); [5] Lee, Skillman & Venn (2005); [6] Sakai, Madore & Freedman (1997); [7] Tosi et al. (1991); [8] Magrini et al. (2005); [9] Soszynski et al. (2006); [10] Greggio et al. (1993); [11] Evans et al. (2006); [12] Peña, Stasinska & Richer (2007); [13] Gieren et al. (2006); [14] Gallart et al. 1996a,b; [15] Tolstoy et al. (2001); [16] Venn et al. (2001); [17] Lee, Skillman & Venn (2006); [18] Wyder (2001), Wyder (2003); [19] Clementini et al. (2003); [20] Dolphin et al. (2002); [21] Cole et al. (2007); [22] Brown et al. (2007); [23] van Zee, Skillman & Haynes (2006); [24] Dolphin et al. (2003a); [25] Dolphin et al. (2003b); [26] Kaufer et al. (2004); [27] Kniazev et al. (2005); [28] Pietrzynski et al. (2006); [29] Skillman et al. (2003); [30] Bresolin et al. (2007); Tautvaisiene et al. (2007); [31] Peimbert, Bohigas & Torres-Peimbert (1988); [32] Skillman et al. 2009 in prep. (LCID); [33] Momany et al. (2005); [34] Skillman, Terlevich & Melnick (1989); [35] McConnachie et al. (2005); [36] Gallagher et al. (1998); [37] Skillman, Bomans & Kobulnicky (1997); [38] McConnachie et al. (2006); [39] Miller et al. (2001); [40] Cook et al. (1999); [41] Hildago et al. 2009, in prep. (LCID); [42] Held, Saviane & Momany (1999); [43] Holtzman, Smith & Grillmair (2000), Young et al. (2007); [44] Gallart et al. (2001), Irwin & Tolstoy (2002); [45] Irwin et al. (2007); [46] de Jong et al. (2008a); [47] Simon & Geha (2007); [48] Hilditch, Howarth & Harries (2005); [49] Dolphin et al. (2001); [50] Carrera et al. (2008), Harris & Zaritsky (2006); [51] Hill, Barbuy & Spite (1997), Venn (1999), Evans et al. (2005); [52] Vermeij & van der Hulst (2002); [53] Harris & Zaritsky (2004); [54] Noël et al. (2007); [55] Cignoni et al. (2009); [56] Tolstoy et al. (1995); [57] Dohm-Palmer et al. (1998); [58] Mateo 1998; [59] van Zee, Skillman & Haynes (2006); | |||||||||||
Tables 1 & 2 are presented in a uniform way to allow an easy comparison between the synthetic CMD analyses for different galaxies over a range of distances. In these Tables we do note if there is supporting evidence for an ancient population (i.e., RR Lyr variable stars) that is not clearly seen in the CMD (e.g., the HB and/or the oldest MSTOs are not visible). Leo A is a good example of this, where the presence of RR Lyr variable stars show that there is an ancient stellar population that is not apparent from the CMD (see Fig. 5). This is also true for NGC 6822, and for some of the early-type galaxies.
| Galaxy | D (kpc) | MVa | rh (')b | instrument (fov) | look-backc | 10
Myr |
1-8 Gyr | 10
Gyr |
Spectroscopy | ||
| LRd | HRd | HII | |||||||||
| (1) | (2) | (3) | (4) | (5) | (6) | (7) | (8) | (9)e | (10) | (11) | (12) |
| Carina | 101±5 [1] | -9.3 | 28.8±3.6 | CTIO4m (15') [2] | oMSTO | x | √ | √ | [3] | [4,5] | x |
| WFPC2 (160") [6,7]f | oMSTO | x | √ | RRL[8] | |||||||
| Leo I | 254±17 [9] | -11.9 | 12.6±1.5 | WFPC2 (160") [6,7,10]f | oMSTO | x | √ | RRL[11] | [12] | [4] | x |
| Leo II | 233±15 [13] | -9.8 | 8.7±0.9 | WFPC2 (160") [6,7]f | oMSTO | x | √ | √ | [14] | [15] | x |
| WFCAM (14') [16] | HB | x | √ | √ | |||||||
| Ursa Min | 70±9 [17] | -9.0 | 50.6±3.6 | WFPC2 (160") [6,7]f | oMSTO | x | √ | √ | [18] | [19] | x |
| INT/WFC (23' × 11') [20] | oMSTO | x | √ | √ | |||||||
| KPNO0.9m (23') [21] | oMSTO | x | √ | √ | |||||||
| Draco | 76±6 [22] | -8.6 | 28.3±2.4 | INT/WFC (23' × 11') [23] | oMSTO | x | √ | √ | [18] | [19, 24] | x |
| WFPC2 (160") [7] | oMSTO | x | √ | √ | |||||||
| Sculptor | 85.9±5 [25] | -11.2 | 76.5±5 | WFPC2 (160") [7] | oMSTO | x | √ | √ | [26] | [4, 27] | x |
| Fornax | 138±5 [28] | -13.2 | 71±4 | ESO/WFI (34') [29] | oMSTO | x | √ | √ | [30] | [4, 31] | x |
| FORS (7') [32] | oMSTO | x | √ | √ | |||||||
| Cetus | 775±50 [33] | -10.1 [33] | 4.8[33] | ACS (195") [34] | oMSTO | x | √ | √ | [35] | ... | x |
| Tucana | 880±40 [36] | -9.6 | 3.7±1.2 | ACS (195") [37] | oMSTO | x | √ | √ | [38] | ... | x |
| NGC 185 | 616±26 [39] | -15.5 | 16±2 | NOT (3.8') [40] | TRGB | x | √ | RRL[41] | ... | ... | x |
| NGC 205 | 824±27 [39] | -16.6 | 6.2±0.2 | NOT (3.8') [40] | TRGB | x | √ | RRL[42] | [43] | ... | x |
| BooI | 62±3 [44, 45] | -5.8 [45] | 12.8±0.7[45] | SDSS (> 8000o) [46] | HB | x | √ | √ | [47, 48] | [50] | x |
| CVnI | 220±20 [45] | -7.9 [45] | 8.5±0.5[45] | SDSS (> 8000o) [46] | HB | x | √ | √ | [48, 49] | ... | x |
| UMaII | 32±5 [45] | -3.8 [45] | ~ 12[45] | SDSS > 8000o() [46] | HB | x | √ | √ | [48] | [51] | x |
| a From Mateo 1998, updated using new distances, except where otherwise indicated | |||||||||||
| bHolmberg limit, from, Mateo 1998, except where otherwise indicated | |||||||||||
| cfaintest main features visible in the CMD: tip of the red giant branch (TRGB), Horizontal Branch (HB), oldest Main Sequence Turnoffs (oMSTO) | |||||||||||
| dindividual RGB stars | |||||||||||
| eIf the CMD is ambiguous as to the presence of an HB, but the presence of ancient stars has been confirmed by the measurement of RR~Lyr variable stars, this is noted | |||||||||||
| fsame data set, different analyses | |||||||||||
| [1] Mateo, Hurley-Keller & Nemec (1998); [2] Hurley-Keller, Mateo & Nemec (1998); [3] Koch et al. (2006); [4] Shetrone et al. (2003); [5] Koch et al. (2008a); [6] Hernandez, Gilmore & Valls-Gabaud (2000); [7] Dolphin (2002); [8] Saha, Monet & Seitzer (1986); [9] Bellazzini et al. (2004); [10] Gallart et al. (1999); [11] Held et al. (2001); [12] Bosler, Smecker-Hane & Stetson (2007), Koch et al. (2007b), Mateo, Olszewski & Walker (2008); [13] Bellazzini, Gennari & Ferraro (2005); [14] Koch et al. (2007a); [15] Shetrone et al. (2009); [16] Gullieuszik et al. (2008) [17] Nemec, Wehlau & Mendes de Oliveira (1988); [18] Wilkinson et al. (2004), Muñoz et al. (2005); [19] Shetrone, Côté & Sargent (2001), Sadakane et al. (2004); [20] Carrera et al. (2002); [21] Ikuta & Arimoto (2002); [22] Bonanos et al. (2004); [23] Aparicio, Carrera & Martínez-Delgado (2001); [24] Smith et al. (2006), Fulbright, Rich & Castro (2004); [25] Pietrzynski et al. (2008); [26] Tolstoy et al. (2004), Coleman, Da Costa & Bland-Hawthorn (2005), Westfall et al. (2006), Battaglia et al. (2008a); [27] Hill et al. 2009, in prep.; [28] Rizzi et al. (2007); [29] Coleman & de Jong (2008); [30] Battaglia et al. (2006), Walker et al. (2006a); [31] Letarte et al. 2009, in prep.; [32] Gallart et al. (2005) [33] Whiting, Hau & Irwin (1999); [34] Monelli et al. (2009) in prep. (LCID); [35] Lewis et al. (2007); [36] Castellani, Marconi & Buonanno (1996), Saviane, Held & Piotto (1996); [37] Gallart et al. (2009) in prep. (LCID); [38] Fraternali et al. (2009); [39] McConnachie et al. (2005); [40] Martínez-Delgado, Aparicio & Gallart (1999); [41] Saha & Hoessel (1990); [42] Saha, Hoessel & Krist (1992); [43] Geha et al. (2006); [44] Siegel (2006); [45] Martin et al. (2008b); [46] de Jong et al. (2008b); [47] Muñoz et al. (2006a); [48] Simon & Geha (2007); [49] Ibata et al. (2006); [50] Norris et al. (2008); [51] Frebel et al. (2009) | |||||||||||
In Tables 1 & 2 we
have included the most
recent distance measurements, with references, in column 2. We have
then updated the absolute magnitude, MV, typically from
Mateo (1998),
in column 3. We include the
physical size (the Holmberg radius, rh) of each galaxy in
arc-minutes, in column 4. This is to highlight the fraction of the
area of the galaxy covered by the instrument used to image the galaxy,
which is given in column 5. In columns 6-9 we have given an overview
of the depth and detail of the CMD analysis allowed by the different
data sets. Sometimes there is more than one data set per galaxy:
column 6 lists the faintest feature detectable in the CMD; column 7
indicates if populations of
10 Myr were detected or
not; column 8 indicates if populations in the range 2-8 Gyr are
detected; and column 9 indicates if populations older than 10 Gyr
were detected. In
the case where a column contains a "?" this means that the CMD was
not deep enough to determine if stars in this age range exist. A
column which contains an "x" means that stars of this age were
explicitly not detected. In the last three columns we give an overview of
the spectroscopic measurements that exist for individual stars
(columns 10, 11) and HII regions in column 12. Column 10 indicates,
with a reference, if individual stars in the galaxy have been observed
at low resolution (R < 10000), typically to determine metallicities,
from a single indicator, or kinematics. Column 11 indicates, with a
reference, if individual stars in the galaxy have been observed at
high resolution (R > 18000), to determine abundances of
different elements. In late-type galaxies typically these analyses are
carried out on young massive stars (e.g., B super-giants), and for the
closer by early-type galaxies, which do not contain young stars, this
typically means RGB stars. In column 12 we indicate if
HII region spectroscopy has been carried out (obviously this is only
possible in galaxies with recent star formation). It should be noted
that we have not included all synthetic analyses. In some cases
there are multiple studies of one system, and in this case usually the
most recent is quoted. Sometimes however the older study is not
superseded (usually because it covers a more significant fraction of
the system), and in this case more than one study is listed. In the
particular case of studies of several large dSphs
(Table 2),
we have included more than one study based on the same HST data where the
results were not the same (e.g., Carina dSph).
The 3D physical spatial distribution of the different types of dwarf galaxy in the Local Group has been displayed in increasing detail over the last years (e.g., Grebel 1999) and most recently by Mateo (2008), including the newly discovered uFds as well as globular clusters and also the most recent version of the morphology-density relation. This shows that galaxies which are currently forming stars are preferentially to be found more than ~ 300 kpc away from the MW, and thus the difference between the distribution of dSph and dI around the MW gives a clear indication of the possibility of morphological transformation.
2.2.1 EARLY-TYPE DWARF GALAXIES: : Early-type galaxies, such as dSphs, are typically associated with large galaxies like our own. They are among the systems closest to us, with the majority at distances < 130 kpc, although there are also several more distant examples. Arguably the new uFds are an extension of the dSph class down to much lower luminosities. The dSph systems typically look very much like the old extended stellar populations which appear to underlie most late-type systems. This suggests that the major difference is that they lack gas and recent star formation, an hypothesis supported by their overlapping structural properties (see Fig. 1). They have typically not formed stars for at least several 100 Myr (e.g., Fnx), and in several cases for much longer (e.g., the Scl dSph apparently formed the majority of its stars more than 10 Gyrs ago).
The proximity of dSphs makes it easier to carry out studies of their resolved stellar populations, although this requires wide field instrumentation to efficiently gain an overview as they are typically > 1 degree across on the sky. The most famous example is Carina, which has been much studied over the years. It was one of the first galaxies shown, from deep wide field imaging on the CTIO 4m telescope, to have completely distinct episodes of star formation (Smecker-Hane et al. 1996, Hurley-Keller, Mateo & Nemec 1998), identified by three distinct MSTOs in the CMD (see Fig. 4, left-hand side). These distinct MSTOs translate into a SFH (see Fig. 4, right-hand side) which consists of three separate episodes of star formation, with the SFR apparently going to zero in between. The existence of a complex SFH was already inferred from the properties of its variable stars (Saha, Hoessel & Krist 1992), and the red clump and HB morphology (Smecker-Hane et al. 1994) but it took synthesis analysis of a CMD going down to the oldest MSTOs to quantify it (Hurley-Keller, Mateo & Nemec 1998). The resulting SFH is displayed in Fig. 4.
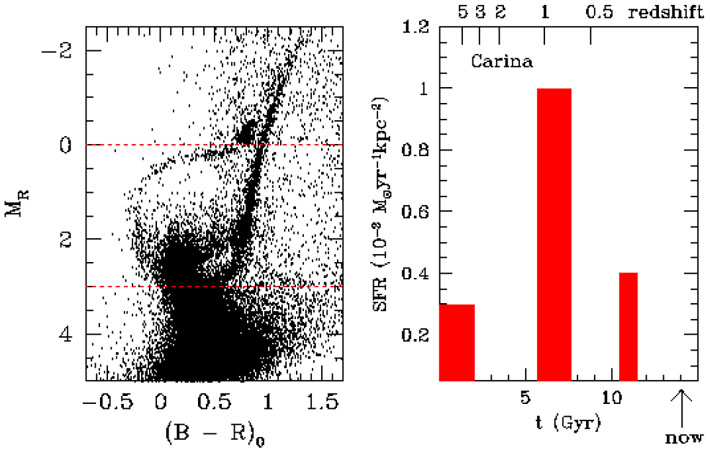 |
Figure 4. On the left-hand side is a CMD of the Carina dSph (taken by M. Mateo with the CTIO4m and MOSAIC camera, private communication) in the central 30' of the galaxy. This clearly shows the presence of at least 3 distinct MSTOs. On the right-hand side is shown the SFH of the central region of Carina determined by Hurley-Keller, Mateo & Nemec (1998), showing the relative strength of the different bursts. |
There have been a number of consistent studies of the Galactic dSphs using HST (Hernandez, Gilmore & Valls-Gabaud 2000, Dolphin 2002). These analyses are typically hampered by the small field of view of HST, compared to the size of the galaxies. Especially as we now know that even these small systems have population gradients, the small field-of-view HST studies are very dependent upon where the telescope is pointing.
There are also more distant dSph galaxies, such as Cetus and Tucana, which display all the characteristics found in the closer-by dSphs, but they are at distances much beyond the halo of the MW and M 31. Tucana is at a distance of 880 kpc and Cetus is at 775 kpc (see Table 1). Both these galaxies have been looked at in great depth by the LCID HST/ACS programme (Gallart & The Lcid Team 2007). Preliminary results for Cetus can be seen in the right hand panel of Fig. 5 (Monelli et al., in prep.). It looks very similar to a predominantly old dSph, like Scl, and it is likely not to have formed any stars over the last 8 Gyr. The small hint of blue plume in the CMD (in Fig. 5) is most likely due to blue stragglers. These are old stars that are known to exist in Galactic dSphs (e.g., Mapelli et al. 2007, Momany et al. 2007), and which have undergone mass transfer and appear rejuvenated, but should not be confused with more recent star formation activity.
Wirth & Gallagher (1984), first made the distinction between diffuse and compact dEs, namely between NGC 205-like and M 32-like galaxies, immediately confirmed by Kormendy (1985) for a larger sample. The issue has been comprehensively reviewed by Kormendy et al. (2008), who show that the physical properties of M 32 place it as a low-luminosity Elliptical galaxy (see Fig. 1). This also suggests that M 32 is not compact because of any kind of tidal pruning, but because of their intrinsic evolutionary history and/or formation scenario.
Compact objects like M 32 are rare (there is only one in the Local Group), whilst more diffuse dwarfs, like dSphs and NGC 205 are much more common. Thus the three compact systems around M 31, NGC 205, NGC 185 & NGC 147 are all big spheroidals, not small ellipticals, as is clear from their position in Fig. 1. These systems have typically not had much attention from CMD synthesis modelling, see Table 2. This is probably due to the fact that they are quite distant, and compact, which makes accurate photometry very challenging even with the help of HST.
There is in addition the class of UCDs
which appear to be found only in nearby galaxy clusters, such as
Fnx (e.g.,
Evstigneeva et
al. 2008).
They may be objects like
 Cen,
which is now often considered to be the tidally stripped nucleus
of a compact system. The structural properties of
Cen
and UCDs
clearly overlap (see Fig. 1).
They have also been proposed to be
low-luminosity Ellipticals like M 32, but
Fig. 1 would tend
to argue against this.
Cen,
which is now often considered to be the tidally stripped nucleus
of a compact system. The structural properties of
Cen
and UCDs
clearly overlap (see Fig. 1).
They have also been proposed to be
low-luminosity Ellipticals like M 32, but
Fig. 1 would tend
to argue against this.
2.2.2 LATE-TYPE DWARF GALAXIES: These galaxies have long been well studied in the Local Group, and they have proved themselves valuable tools for understanding the wider Universe, starting from the monitoring of Cepheid variable stars in NGC 6822 by E. Hubble in 1925, and the subsequent realisation that a larger Universe existed beyond our MW. The dIs have also long been used as probes of metal-poor star formation, both young and old. They still retain HI gas, and are thus, with a few curious exceptions, typically forming stars at the present time as they have probably done over their entire history, with a variety of rates, from extremely low (e.g., Pegasus) to zero (e.g., transition systems DDO 210, LGS 3) to relatively high (e.g., NGC 6822, SMC). The dIs were the first systems to which synthetic CMD analysis was applied (e.g., WLM, Sextans B). They are a numerous and often fairly luminous class within the Local Group. They are typically at a distance > 400 kpc (the SMC being a notable exception), see Table 1. Studies down to the oldest MSTOs of dIs typically require HST-like sensitivity and image stability.
HST has had a large impact on studies of these systems. The exceptionally detailed CMDs from WFPC2 allowed for the first time the clear distinction between the main sequence and the blue loop sequence in young metal-poor systems (e.g., Sextans A, Dohm-Palmer et al. 1997). Photometric errors previously blended these sequences in "the blue plume" and there were debates about the reliability of the theoretical predictions of blue loop stars. These stars have been subsequently shown to be powerful tools for mapping the spatial variations in the SFR over the last 800 Myr (Dohm-Palmer et al. 1998, Dohm-Palmer et al. 2002). The resulting space/time variations are intriguingly reminiscent of the predictions of the stochastic self-propagating star formation proposed by Seiden, Schulman & Gerola (1979) 30 years ago, with star formation coming and going in different regions over periods of several hundred Myr.
The HST/ACS CMD of Leo A (from Cole et al. 2007), see Fig. 5 (central panels), is one of the deepest and most accurate ever made for a dI. The SFR as a function of time over the entire history of the galaxy was determined using synthetic CMD analysis (see Fig. 5), and it was found that 90% of the star formation in Leo A happened during the last 8 Gyr. There is a peak in the SFR 1.5-3 Gyr ago, when stars were forming at a level 5-10 times the current rate. The CMD analysis of Leo A only required a very slight metallicity evolution with time. The mean inferred metallicity in the past is consistent with measurements of the present-day gas-phase oxygen abundance. There appears to have been only a small and uncertain amount of star formation in Leo A at the earliest times, as the HB is very weak in the CMD in Fig. 5. The error bars on the SFH (see Cole et al. 2007) show that from CMD analysis alone this ancient population is not well defined. The only definite proof of truly ancient stars in Leo A comes from the detection of RR Lyrae variable stars (Dolphin et al. 2002).
 |
Figure 5. HST/ACS CMDs and SFHs for three Local Group dwarf galaxies: LGS 3 a transition type dwarf galaxy (Hildago et al. in prep); Leo A a dwarf irregular (Cole et al. 2007); and Cetus a distant dwarf spheroidal galaxy (Monelli et al. in prep.). These results come from the LCID project (Gallart & The Lcid Team 2007, Cole et al. 2007), which is a large programme designed to exploit the exquisite image quality of the HST/ACS to obtain uniquely detailed CMDs going back to the oldest MSTOs for a sample of dwarf galaxies. The SFHs in the lower panels come from synthetic CMD analysis. |
Fig. 5 also shows a preliminary HST/ACS CMD and SFH derived for LGS 3 (Hildago et al., in prep), which is a transition type galaxy. This means that it contains HI gas, but no very young stars (no HII regions, and no super-giants). From the CMD it looks like it has been forming stars at a low rate for a very long time with a gradually declining rate, and the present day hiatus is just a normal event in its very low average SFR.
2.2.3 ULTRA-FAINT DWARF GALAXIES An ever increasing number of extremely faint systems (uFds) are being found by SDSS around the MW. As displayed in Fig. 1 they appear somewhat offset in the MV - r1/2 plane, although this may be due to the observational difficulties in accurately determining their physical extent. In the MV - µV plane they appear to be the extension of the dSph sequence to lower luminosity rather than a new class of object. However it is clear from both plots in Fig. 1 that especially the fainter of these new systems exist in a region where the extension of classical dwarf galaxies and globular cluster sequences may lie. In several cases the properties of the uFds appear to resemble more diffuse (perhaps tidally disrupted) metal poor globular clusters rather than dwarf galaxies. From a careful study of the structural properties of uFds (Martin, de Jong & Rix 2008) it can be seen that these new systems range in absolute magnitude from MV = -1.5 (Segue I) to MV = -8.0 (Leo T). Leo T and CVn I (MV = -7.9) are the two brightest of these new systems although they are measurably fainter and with lower surface brightness than any of the "classical" dwarfs they are consistent with a lower luminosity extension of the dI and dSph type galaxies. There are ~ 8 systems at -7 < MV < -4.0 (Boo I, UMa I, UMa II, Leo IV, Leo V, CVn II, Coma and Her), and most of the rest are at MV > -3.0 (e.g., Wil I, Segue I, Segue II and Boo II & III). The more luminous and populous CVn I contains a mix of Oosterhoff type I & II RR Lyr variable stars (Kuehn et al. 2008), as is typical for dSph, whereas the fainter systems do not. So far most of these new uFds have been found in the immediate vicinity of the MW. The bright systems Leo T, at 410 kpc, and CVn I, at 218 kpc are the most distant, and the typical distances of the fainter systems range between 23 kpc (Seg I) & 160 kpc (Leo IV, CVn II). These faint and diffuse systems are challenging to study and it is virtually impossible to detect them beyond these distances.
Some of these new systems have had their stellar populations analysed using the synthetic CMD method (e.g., de Jong et al. 2008b). However the SFHs, and even the basic physical properties of the faintest of these systems can be particularly sensitive to the effect that large and uncertain Galactic contamination brings to small number statistics (e.g., Martin, de Jong & Rix 2008). In several cases it is impossible to distinguish the stars which are in uFds from those in the MW without spectroscopic follow-up, and even then they are often found to only contain few RGB stars, or to have kinematics almost indistinguishable from either the Sagittarius (Sgr) tidal streams or the Galaxy (e.g., Geha et al. 2009). This makes separating these systems out from the surrounding stars and determining their properties quite challenging.
Another approach is to look for distinctive stellar populations, such as blue HB (BHB) stars, or RR Lyr variable stars which clearly stand out from the Galactic stellar population. These are usually still small number tracer populations but at least they are clear markers of the spatial extent and age of these small and faint systems (e.g., for Boo I, Dall'Ora et al. 2006). In the case of Leo V it can be seen from the BHB stars that the galaxy has a much more extended stellar component than the half-light radius would suggest (see Fig. 6, Belokurov et al. 2008). These smallest systems are clearly being disrupted and understanding what they were before this process began is challenging.
It is possible that some of these systems are no more than over-density enhancements along a stream, and possibly along streams related to Sgr. For example, Segue I has the same space and velocity distribution of a supposed ancient leading arm of Sgr, wrapped 520° around the MW (e.g., Geha et al. 2009). Similarly Boo II and Coma are believed to lie within streams originating from Sgr. In the case of Leo IV and Leo V they lie on top of (although clearly behind) the Orphan stream, and thus kinematic information is needed to hope to disentangle their stars from the complex fore/background stellar populations lying in that direction. The newly discovered Segue II system (Belokurov et al. 2009) is also found to lie along the edge of a Sgr stream and to perhaps be embedded in a stream of its own. In this case it is postulated to be evidence for groups of galaxies falling onto the MW simultaneously.
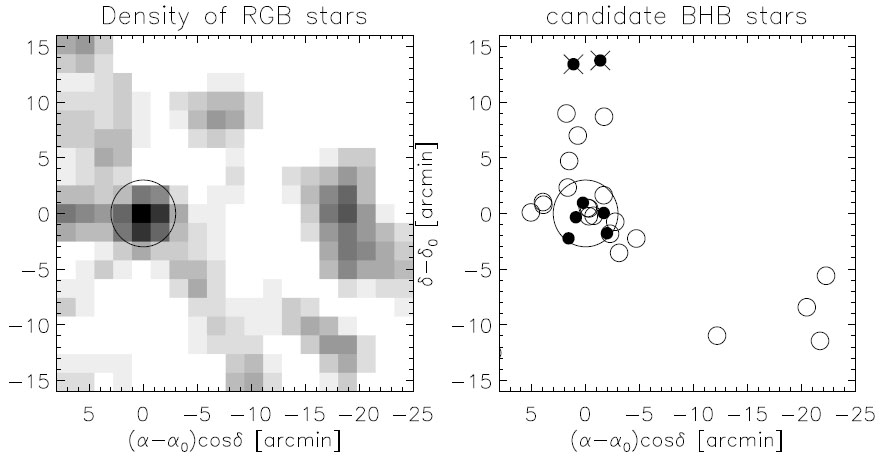 |
Figure 6. From
Belokurov et
al. (2008).
Left: The density of RGB candidate members selected from
photometry. The extent of Leo V as judged from two half-light
radii is marked. Right: The locations of BHB candidate members.
Note that the BHB distribution is elongated and more extended than that
of the RGB stars. Black dots are RGB stars with spectroscopy,
v |
2.2.4 THE SMALL MAGELLANIC CLOUD:
The closest galaxies (excepting some of the new uFds)
are the Magellanic Clouds, and their SFHs can be studied in quite some
detail. The SMC is an irregular galaxy at the boundary of the dwarf
class. As can be seen from Fig. 1, this
does not have a clear physical distinction, and the cut-off is
arbitrary. Hence, the SMC can be considered the closest late-type
dwarf. It shares key properties with this type of galaxy: high gas
content, low current metallicity (Z
 0.004 in mass fraction)
and low mass (between 1 and 5 × 10⁹
M
0.004 in mass fraction)
and low mass (between 1 and 5 × 10⁹
M ,
Kallivayalil,
van der Marel & Alcock 2006),
near the upper limit of the range of masses typical of late-type dwarfs.
,
Kallivayalil,
van der Marel & Alcock 2006),
near the upper limit of the range of masses typical of late-type dwarfs.
The SMC hosts several hundreds star clusters and several populous clusters, covering all ages from 11 Gyr (NGC 121, e.g., Glatt et al. 2008) to a few Myr (e.g., NGC 346 and NGC 602, Sabbi et al. 2007, Cignoni et al. 2009).
Accurate photometry down to the oldest MSTOs is feasible from the ground, although time consuming, and HST allows measurements of both the oldest and the youngest objects, including pre-MS stars, although with fields of view covering only a tiny fraction of the galaxy. While stars at the oldest MSTOs and sub-giant branch are the unique means to firmly establish the SFH at the earliest epochs, pre-MS stars are precious tools to study the details of the most recent SFH (Cignoni et al. 2009), in terms of time and space behaviour. The SMC regions of intense recent star formation can provide key information on the star formation mechanisms in environments with metallicity much lower than in any Galactic star forming region. As an example, Fig. 7 shows the CMD of the young cluster NGC 602 in the Wing of the SMC, observed with HST/ACS. Both very young stars (either on the upper MS or still on the pre-MS) and old stars are found. The SFH of the cluster and the surrounding field is also shown, revealing that the cluster has formed most of its stars around 2.5 Myr ago, while the surrounding field has formed stars continuously since the earliest epochs. The SFR in this SMC region appears to be quite similar to that of Galactic star forming regions (Cignoni et al. 2009 and references therein).
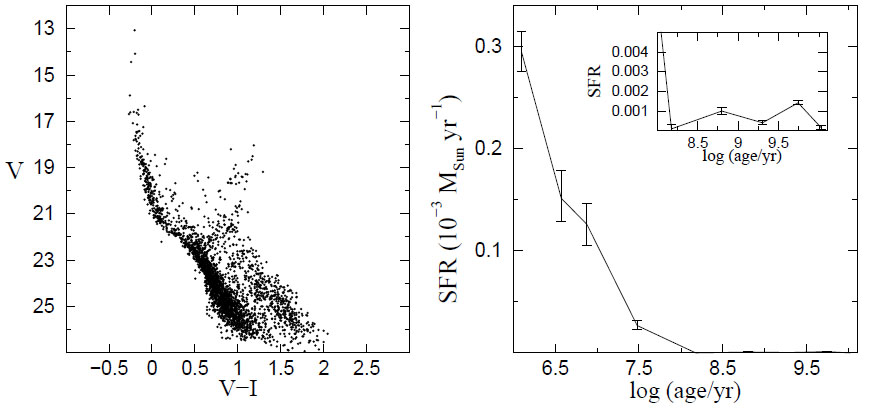 |
Figure 7. Left-hand panel: CMD of the HST/ACS field around the young cluster NGC 602 in the SMC. The bright blue plume contains the young cluster stars. The red sequence of pre-MS stars of lower-mass which have not yet made it on to the main sequence are also easily recognisable. Also visible are the old Main Sequence and evolved stars of the SMC field population. Notice that the lower Main Sequence is only populated by field stars, since the cluster stars with mass below (PUT IN THE NEXT LINE) haven't yet had time to reach it. Right-hand panel: corresponding SFH as derived with the synthetic CMD method (Cignoni et al. 2009). The oldest part of the SFH is shown as an inset panel in the upper right. |
Despite being the nearest dI system, the SMC has been less studied than might be expected. For instance the SFHs derived from synthetic CMDs, have so far only been based on a few ground-based studies (Harris & Zaritsky 2004, Chiosi et al. 2006, Noël et al. 2007), and a few HST-based ones on small individual regions (Dolphin et al. 2001, McCumber, Garnett & Dufour 2005, Cignoni et al. 2009). New extensive surveys to infer the SFH of the whole SMC back to the earliest epochs are planned (Cioni et al. 2008, Tosi et al. 2008), both at visible and near infrared wavelengths.
Harris & Zaritsky (2004) were the first to apply the synthetic CMD method to the derivation of the SMC SFH. They mapped the whole SMC from the ground and concluded that 50% of its stars are older than 8.4 Gyr and diffused over the whole body of the galaxy. They also found an indication of a long period of moderate (possibly zero) activity between 3 and 8.4 Gyr ago. Their photometry however didn't reach the oldest MSTO and all the studies (Dolphin et al. 2001, McCumber, Garnett & Dufour 2005, Noël et al. 2007, Cignoni et al. 2009, Tosi et al. 2008) which do reach it indicate that, although present, stars older than 8 Gyr do not dominate the SMC population. From the latter studies, the population bulk seems to peak at ages somewhat younger than 6-9 Gyr essentially everywhere in the SMC main body.
The dwarf galaxies which have been studied using the CMD synthesis method beyond the Local Group are predominantly actively star forming BCDs (e.g., I Zw 18; NGC 1705). These galaxies are typically quite distant, but as there are no obvious BCDs in the Local Group (with the possible exception of IC 10 hidden behind a lot of foreground obscuration from the MW) there is no other possibility to study this class of actively star forming, yet low metallicity, systems.
In galaxies beyond the Local Group, distance makes crowding more severe, and even HST cannot resolve stars as faint as the MSTO of old populations. The further the distance, the worse the crowding conditions, and the shorter the look-back time reachable even with the deepest, highest resolution photometry. Depending on distance and intrinsic crowding, the reachable look-back time in galaxies more than 1 Mpc away ranges from several Gyrs (in the best cases, when the RGB or even the HB are clearly identified) to several hundreds Myr (when AGB stars are recognized), to a few tens Myr (when only the brightest super-giants are resolved). To date, the unique performances of the HST/ACS have allowed us to resolve individual stars on the RGB in some of the most metal-poor BCDs, e.g., SBS 1415+437 at 13.6 Mpc (Aloisi et al. 2005) and I Zw 18 at 18 Mpc (Aloisi et al. 2007). The discovery of stars several Gyrs old in these extremely metal-poor galaxies is key information for understanding these systems and placing them in the proper context of galaxy formation and evolution studies.
Not many groups have embarked on the challenging application of the synthetic CMD method beyond the Local Group (for a summary see Tosi 2007b) and most of them have concentrated their efforts on starbursting late-type dwarfs. In Fig. 8, some examples of the SFH of external late-type dwarfs are shown. All these SFHs have been derived with the synthetic CMD method applied to HST/WFPC2 or NICMOS photometry. The look-back time reached by the photometry is indicated by the thin vertical line in each panel, and in all cases stars of that age were detected. For those galaxies that have subsequently been observed with the HST/ACS, the look-back time is significantly longer, and the further back we look we always find indisputable evidence of star formation activity at that increasingly old epoch. This means that there is no evidence that any of these systems is younger than the look-back time. The sample of galaxies shown in Fig. 8 is not homogeneous: UGC 5889 is a low surface brightness galaxy (LSB), whilst NGC 1705, I Zw 18, I Zw 36 and Mrk 178 are BCDs, and NGC 1569 is classified as dI. Nonetheless, all these dwarfs show qualitatively similar behaviour, with a strong current burst superimposed on a moderate and rather continuous underlying star formation activity. Quantitatively, the actual SFRs differ between galaxies by orders of magnitude. Notice that the least active system is one of the BCDs (Mrk 178) and the most active is the dI (NGC 1569). This is not what one would have expected on the basis of their morphological classification. This highlights the difficulties in making accurate classification of the structural properties of these active, compact systems. If NGC 1569 were at a distance of 20 Mpc it would most likely have been classified as a BCD. The SFR in NGC 1569 is actually about a factor two higher than shown in Fig. 8, as more recent HST/ACS imaging has detected the RGB, and made a significant revision of the distance to NGC 1569, to make it almost a magnitude farther away than previously thought (Grocholski et al. 2008).
 |
Figure 8. SFHs of late-type dwarfs outside the Local Group. In all panels the SFR per unit area as a function of time is plotted. The thin vertical line indicates the look-back time reached by the adopted photometry. References: NGC 1569, Greggio et al. (1998), Angeretti et al. (2005); NGC 1705, Annibali et al. (2003); I Zw 18, Aloisi, Tosi & Greggio (1999); I Zw 36, Schulte-Ladbeck et al. (2001); Mrk 178, Schulte-Ladbeck et al. (2000); UGC 5889, Vallenari, Schmidtobreick & Bomans (2005). |
An interesting result of the SFH studies both in the Local Group and
beyond is
that the vast majority of dwarfs have, and have always had, fairly
moderate star formation activity. From an extensive
H study of 94
late-type galaxies
Hunter &
Elmegreen (2004)
found that the typical SFR of irregular galaxies is 10-3
M
yr-1 kpc-2 and that
of BCDs is generally higher but not by much. They also found that
NGC 1569 and NGC 1705 are among the few systems with unusually high
SFRs (see Fig. 8). Hunter & Elmegreen
conclude that the star formation regions are not intrinsically
different in the various galaxy types, but they crowd more closely
together in the centers of BCDs.
 173 kms-1
and low equivalent width of the MgT feature.
173 kms-1
and low equivalent width of the MgT feature.