

Large scale structure is defined as the structure or inhomogeneity of the Universe on scales larger than that of a galaxy. The idea of whether galaxies are distributed uniformly in space can be traced to Edwin Hubble, who used his catalog of 400 "extragalactic nebulae" to test the homogeneity of the Universe (Hubble 1926), finding it to be generally uniform on large scales. In 1932, the larger Shapley-Ames catalog of bright galaxies was published (Shapley & Ames 1932), in which the authors note "the general unevenness in distribution" of the galaxies projected onto the plane of the sky and the roughly factor of two difference in the numbers of galaxies in the northern and southern galactic hemispheres. Using this larger statistical sample, Hubble (1934) noted that on angular scales less than ~ 10° there is an excess in the number counts of galaxies above what would be expected for a random Poisson distribution, though the sample follows a Gaussian distribution on larger scales. Hence, while the Universe appears to be homogeneous on the largest scales, on smaller scales it is clearly clumpy.
Measurements of large scale structure took a major leap forward with the Lick galaxy catalog produced by Shane & Wirtanen (1967), which contained information on roughly a million galaxies obtained using photographic plates at the 0.5m refractor at Lick Observatory. Seldner et al. (1977) published maps of the counts of galaxies in angular cells across the sky (see Fig. 1), which showed in much greater detail that the projected distribution of galaxies on the plane of the sky is not uniform. The maps display a rich structure with a foam-like pattern, containing possible walls or filaments with long strands of galaxies, clusters, and large empty regions. The statistical spatial distribution of galaxies from this catalog and that of Zwicky et al. (1968) was analyzed by Jim Peebles and collaborators in a series of papers (e.g., Peebles 1975) that showed that the angular two-point correlation function (defined below) roughly follows a power law distribution over angular scales of ~ 0.1° - 5°. In these papers it was discovered that the clustering amplitude is lower for fainter galaxy populations, which likely arises from larger projection effects along the line of sight. As faint galaxies typically lie at larger distances, the projected clustering integrates over a wider volume of space and therefore dilutes the effect.
 |
Figure 1. Angular distribution of counts of galaxies brighter than B ~ 19 on the plane of the sky, reconstructed from the Lick galaxy catalog (from Seldner et al. 1977). This image shows the number of galaxies observed in 10' × 10' cells across the northern galactic hemisphere, where brighter cells contain more galaxies. The northern galactic pole is at the center, with the galactic equator at the edge. The distribution of galaxies is clearly not uniform; clumps of galaxies are seen in white, with very few galaxies observed in the dark regions between. |
These results in part spurred the first large scale redshift surveys, which obtained optical spectra of individual galaxies in order to measure the redshifts and spatial distributions of large galaxy samples. Two of of the first redshifts surveys which were the KOS survey (Kirshner, Oemler, Schechter; Kirshner et al. 1978) and the original CfA survey (Center for Astrophysics; Davis et al. 1982). The KOS survey measured redshifts for 164 galaxies brighter than magnitude 15 in eight separate fields on the sky, covering a total of 15 deg2. Part of the motivation for the survey was to study the three dimensional spatial distribution of galaxies, about which the authors note that "although not entirely unexpected, it is striking how strongly clustered our galaxies are in velocity space," as seen in strongly peaked one dimensional redshift histograms in each field.
The original CfA survey, completed in 1982, contained redshifts for 2,400 galaxies brighter than magnitude 14.5 across the north and south galactic poles, covering a total of 2.7 steradians. The major aims of the survey were cosmological and included quantifying the clustering of galaxies in three dimensions. This survey produced the first large area and moderately deep three dimensional maps of large scale structure (see Fig. 2), in which one could identify galaxy clusters, large holes or voids, and an apparent "filamentary connected structure" between groups of galaxies, which the authors caution could be random projections of distinct structures (Davis et al. 1982). This paper also performed a comparison of the so-called "complex topology" of the large scale structure seen in the galaxy distribution with that seen in N-body dark matter simulations, paving the way for future studies of theoretical models of structure formation.
 |
Figure 2. Distribution of galaxies in
redshift space from the original CfA galaxy redshift survey
(from Davis et al. 1982).
Plotted are 249 galaxies as a function
of observed velocity (corresponding to a given redshift)
versus right ascension for a wedge in declination of
10° < |
The second CfA redshift survey, which ran from 1985 to 1995, contained spectra for ~ 5,800 galaxies and revealed the existence of the so-called "Great Wall", a supercluster of galaxies that extends over 170 h-1 Mpc, the width of the survey (Geller & Huchra 1989). Large underdense voids were also commonly found, with a density 20% of the mean density.
Redshift surveys have rapidly progressed with the development of multi-object spectrographs, which allow simultaneous observations of hundreds of galaxies, and larger telescopes, which allow deeper surveys of both lower luminosity nearby galaxies and more distant, luminous galaxies. At present the largest redshift surveys of galaxies at low redshift are the Two Degree Field Galaxy Redshift Survey (2dFGRS, Colless et al. 2001) and the Sloan Digital Sky Survey (SDSS, York et al. 2000), which cover volumes of ~ 4 × 10⁷ h3 Mpc-3 and ~ 2 × 10⁸ h3 Mpc-3 with spectroscopic redshifts for ~ 220,000 and a million galaxies, respectively. These surveys provide the best current maps of large scale structure in the Universe today (see Fig. 3), revealing a sponge-like pattern to the distribution of galaxies (Gott et al. 1986). Voids of ~ 10 h-1 Mpc are clearly seen, containing very few galaxies. Filaments stretching greater than 10 h-1 Mpc surround the voids and intersect at the locations of galaxy groups and clusters.
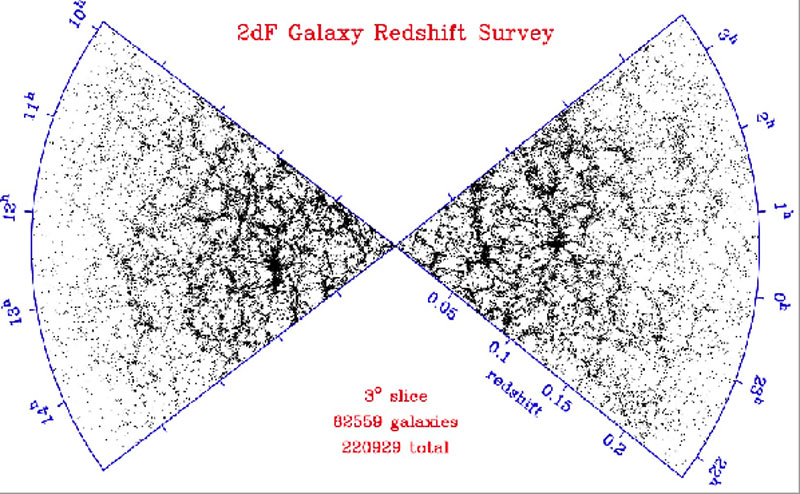 |
Figure 3. The spatial distribution of galaxies as a function of redshift and right ascension (projected through 3° in declination) from the 2dF Galaxy Redshift Survey (from Colless et al. 2004). |
The prevailing theoretical paradigm regarding the existence of large scale structure is that the initial fluctuations in the energy density of the early Universe, seen as temperature deviations in the cosmic microwave background, grow through gravitational instability into the structure seen today in the galaxy density field. The details of large scale structure - the sizes, densities, and distribution of the observed structure - depend both on cosmological parameters such as the matter density and dark energy as well as on the physics of galaxy formation and evolution. Measurements of large scale structure can therefore constrain both cosmology and galaxy evolution physics.
 <
20°.
<
20°.