


 (r)
(r)
The current paradigm of galaxy formation posits that galaxies form in
the center of larger dark matter halos, collapsed overdensities in the
dark matter distribution with
 /
/
 ~
200, inside of which all mass is gravitationally bound.
The clustering of galaxies can then be understood as a combination of
the clustering of dark matter halos, which depends on cosmological
parameters, and how galaxies populate dark matter halos, which depends
on galaxy formation and evolution physics. For a given cosmological
model the properties of dark matter halos, including their evolution
with time, can be studied in detail using N-body simulations. The
masses and spatial distribution of dark matter halos should depend
only on the properties of dark matter, not baryonic matter, and the
expansion history of the Universe; therefore the clustering of dark
matter halos should be insensitive to baryon physics. However, the
efficiency of galaxy formation is very dependent on the complicated
baryonic physics of, for example, star formation, gas cooling, and
feedback processes. The halo model allows the relatively simple
cosmological dependence of galaxy clustering to be cleanly separated
from the more complex baryonic astrophysics, and it shows how
clustering measurements for a range of galaxy types can be used to
constrain galaxy evolution physics.
~
200, inside of which all mass is gravitationally bound.
The clustering of galaxies can then be understood as a combination of
the clustering of dark matter halos, which depends on cosmological
parameters, and how galaxies populate dark matter halos, which depends
on galaxy formation and evolution physics. For a given cosmological
model the properties of dark matter halos, including their evolution
with time, can be studied in detail using N-body simulations. The
masses and spatial distribution of dark matter halos should depend
only on the properties of dark matter, not baryonic matter, and the
expansion history of the Universe; therefore the clustering of dark
matter halos should be insensitive to baryon physics. However, the
efficiency of galaxy formation is very dependent on the complicated
baryonic physics of, for example, star formation, gas cooling, and
feedback processes. The halo model allows the relatively simple
cosmological dependence of galaxy clustering to be cleanly separated
from the more complex baryonic astrophysics, and it shows how
clustering measurements for a range of galaxy types can be used to
constrain galaxy evolution physics.
8.1. Estimating the Mean Halo Mass from the Bias
One can use the observed large scale clustering amplitude of different
observed galaxy populations to identify the typical mass of their
parent dark matter halos, in order to place these galaxies in a
cosmological context. The large scale clustering amplitude of dark
matter halos as a function of halo mass is well determined in N-body
simulations, and analytic fitting formula are provided by e.g.,
Mo & White (1996)
and
Sheth et al. (2001).
Analytic models can then predict
the clustering of both dark matter particles and galaxies as a function
of scale, by using the clustering of dark matter halos and the radial
density profile of dark matter and galaxies within those halos
Ma & Fry 2000,
Peacock & Smith
2000,
Seljak 2000).
In this scheme, on large, linear
scales where  < 1
( /
~
1), the clustering of
a given galaxy population can be used to determine the mean mass of
the dark matter halos hosting those galaxies, for a given cosmological
model. To achieve this, the large-scale bias is estimated by comparing the
observed galaxy clustering amplitude with that of dark matter in an N-body
simulation, and then galaxies are assumed to reside in halos of a
given mass that have the same bias in simulations.
< 1
( /
~
1), the clustering of
a given galaxy population can be used to determine the mean mass of
the dark matter halos hosting those galaxies, for a given cosmological
model. To achieve this, the large-scale bias is estimated by comparing the
observed galaxy clustering amplitude with that of dark matter in an N-body
simulation, and then galaxies are assumed to reside in halos of a
given mass that have the same bias in simulations.
Simulations show that higher mass halos cluster more strongly than lower mass halos (Sheth & Tormen 1999). This then leads to an interpretation of galaxy clustering as a function of luminosity in which luminous galaxies reside in more massive dark matter halos than less luminous galaxies. Similarly, red galaxies typically reside in more massive halos than blue galaxies of the same luminosity; this is observationally verified by the larger "Fingers of God" observed for red galaxies. Combining the large scale bias with the observed galaxy number density further allows one to constrain the fraction of halos that host a given galaxy type, by comparing the galaxy space density to the parent dark matter halo space density. This constrains the duty cycle or fraction of halos hosting galaxies of a given population.
8.2. Halo Occupation Distribution Modeling
While such estimates of the mean host halo mass and duty cycle are fairly straightforward to carry out, a greater understanding of the relation between galaxy light and dark matter mass is gleaned by performing halo occupation distribution modeling.
The general halo-based model discussed above, in which the clustering of galaxies reflects the clustering of halos, was further developed by Peacock & Smith (2000) to include the efficiency of galaxy formation, or how galaxies populate halos. The proposed model depends on both the halo occupation number, equal to the number of galaxies in a halo of a given mass, for a galaxy sample brighter than some limit, and the location of the galaxies within these halos. In the Peacock & Smith (2000) model it is assumed that one galaxy is at the center of the halo (the "central" galaxy), and the rest of the galaxies in the same halo are "satellite" galaxies that trace the dark matter radial mass distribution, which follows an NFW profile (Navarro et al. 1997). The latter assumption results in a general power law shape for the galaxy correlation function.
A similar idea was proposed by
Benson et al. (2000),
who used a semi-analytic model in conjunction with a cosmological N-body
simulation to show that the observed galaxy
(r)
could be reproduced
with a  CDM
simulation (though not with a τ CDM simulation
with
CDM
simulation (though not with a τ CDM simulation
with  matter
= 1). They also employ a method for locating
galaxies inside dark matter halos such that one galaxy resides at the
center of all halos above a given mass threshold, while additional
galaxies are assigned the location of a random dark matter particle
within the same halo, such that galaxies have the same NFW radial profile
within halos as the dark matter particles (see
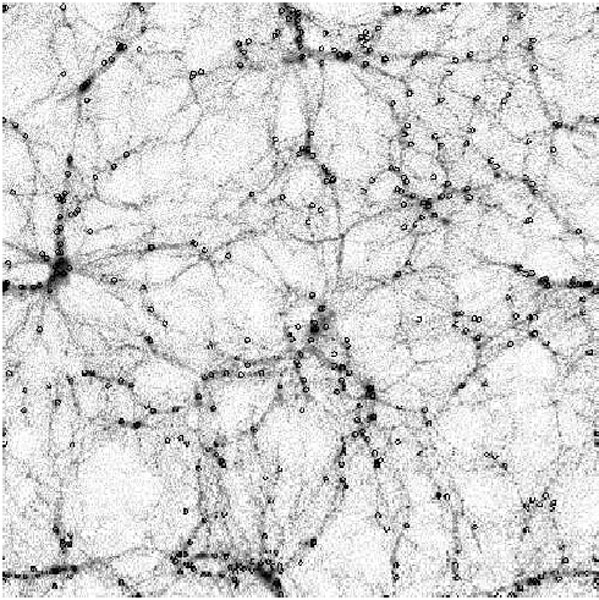
Fig. 10, left panel).
matter
= 1). They also employ a method for locating
galaxies inside dark matter halos such that one galaxy resides at the
center of all halos above a given mass threshold, while additional
galaxies are assigned the location of a random dark matter particle
within the same halo, such that galaxies have the same NFW radial profile
within halos as the dark matter particles (see
Fig. 10, left panel).
In these models, the clustering of galaxies on scales larger
than a typical halo (~ 1-2 h-1 Mpc) results from pairs
of galaxies
in separate halos, called the "two-halo term", while the clustering
on smaller scales ( 1 h-1 Mpc) is due to pairs of galaxies within
the same parent halo, called the "one-halo term".
When the pairs from these two terms are added together, the
resulting galaxy correlation function should roughly
follow a power law.
1 h-1 Mpc) is due to pairs of galaxies within
the same parent halo, called the "one-halo term".
When the pairs from these two terms are added together, the
resulting galaxy correlation function should roughly
follow a power law.
Benson et al. (2000)
show that on large scales there is a simple relation in the
bias between galaxies and dark matter halos, while on small scales the
correlation function depends on the number of galaxies in a halo and
the finite size of halos. When the clustering signal from these two
scales (corresponding to the "two-halo" and "one-halo" terms)
is combined, a power law results for the galaxy
(r) (right
panel,
Fig. 10). Galaxies are found to be anti-biased
relative to dark matter (i.e., less clustered than the dark matter)
on scales smaller than the typical halo, though the bias is
close to unity on larger scales. The clustering of galaxies that
results from this semi-analytic model is also found to match the observed
clustering of galaxies in the APM survey, above a given luminosity threshold
(Baugh 1996).
 |
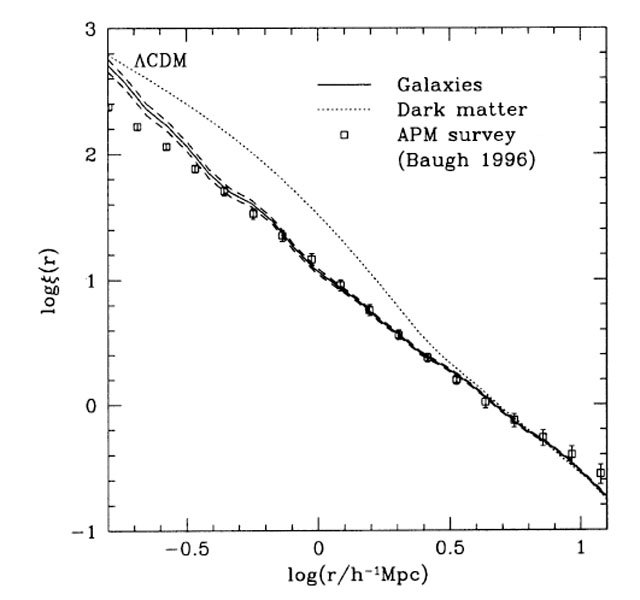 |
Figure 10. Left: The large scale
structure seen in a
|
|
By defining the halo occupation distribution (HOD) as the probability
that a halo of a given mass contains N galaxies,
P(N|M),
Berlind &
Weinberg (2002)
quantify how the observed galaxy
(r)
depends on
different HOD model parameters. Using N-body simulations, they
identify dark matter halos and place galaxies into the simulation
using a simple HOD model with two parameters: a minimum mass at which
a halo hosts, on average, one central galaxy (Mmin) at
the center of the halo, and the slope
( ) of the
P(N|M) function for satellite galaxies. The
latter determines how many satellite galaxies there are as a
function of halo mass. They further assume that the satellite
galaxies follow an
NFW profile, as the dark matter does, though the concentration of the
radial profile can be changed. They show that the "two-halo term"
is simply the halo center correlation function weighted by a large
scale bias factor, while the "one-halo term" is sensitive to both
and the concentration
of the galaxy profile within halos. Obtaining a power law
(r)
therefore strongly constrains the HOD model parameters.
) of the
P(N|M) function for satellite galaxies. The
latter determines how many satellite galaxies there are as a
function of halo mass. They further assume that the satellite
galaxies follow an
NFW profile, as the dark matter does, though the concentration of the
radial profile can be changed. They show that the "two-halo term"
is simply the halo center correlation function weighted by a large
scale bias factor, while the "one-halo term" is sensitive to both
and the concentration
of the galaxy profile within halos. Obtaining a power law
(r)
therefore strongly constrains the HOD model parameters.
Kravtsov et
al. (2004)
propose that the locations of satellite galaxies within dark
matter halos should correspond to locations of subhalos, distinct
gravitationally bound regions within the larger dark matter halos,
instead of tracing random dark matter particles. Using cosmological N-body
simulations, they show that at z > 1
(r) for
galaxies should deviate strongly from
a power law on small scales, due to a rise in the "one-halo term".
In this model, the clustering of galaxies can be understood as the
clustering of dark matter parent halos and subhalos, and the power law
shape that is observed at z ~ 0 is a coincidence of the one- and
two-halo terms having similar amplitudes and slopes at the typical scale
of halos. They find that the formation and evolution of halos and
subhalos through merging and dynamical processes are the main physical
drivers of large scale structure.
With the unprecedentedly large galaxy sample with spectroscopic redshifts
that is provided by SDSS, departures from a power law
(r)
were detected by
Zehavi et al. (2004),
using a volume-limited subsample of 22,000 galaxies from a
parent sample of 118,000 galaxies. The deviations from a power law are
small enough at z ~ 0 that
a large sample covering a sufficiently large cosmological volume is
required to overcome the errors due to cosmic variance to detect
these small deviations. It is found that there is a change in the slope of
(r) on
scales of ~ 1-2 h-1
Mpc; this corresponds to the scale at which the one and two halo term
are equal (see Fig. 11).
Zehavi et al. (2004)
find that
(r)
measured from the SDSS data is better fit
by an HOD model, which includes small deviations from a power law,
than by a pure power law. The HOD model that is fit has three parameters:
the minimum mass to host a single central galaxy (Mmin),
the minimum mass to host a single satellite galaxy
(M1), and the slope of P(N|M)
(), which determines the
average number of satellite galaxies as a function of host halo mass. In
this model, dark matter
halos with Mmin < M <
M1 host a single galaxy, while above
M1 they host, on average, (M /
M1) galaxies.
Using wp(rp), one can fit for
M1 and
, while the observed
space density of galaxies is used to derive Mmin. For
a galaxy
sample with Mr < -21, the best-fit HOD parameters are
Mmin = 6.1 × 10¹² h-1
M ,
M1 = 4.7 × 10¹³ h-1
M, and
= 0.89.
,
M1 = 4.7 × 10¹³ h-1
M, and
= 0.89.
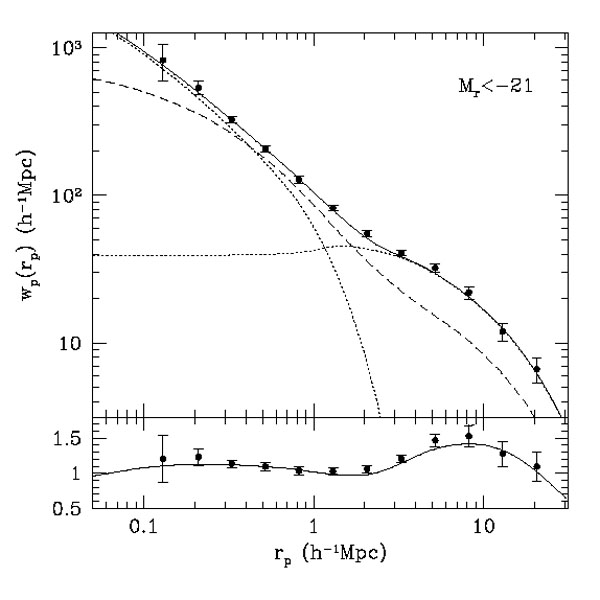 |
Figure 11. The projected correlation function, wp(rp), for SDSS galaxies with Mr < -21 is shown as data points with error bars. The best-fit HOD model is shown as a solid line, with the contributions from the one and two halo terms shown with dotted lines. The projected correlation function of dark matter at this redshift is shown with a dashed line. The bottom panel shows deviations in wp(rp) for the data and the HOD model from the best-fit power law. Taken from Zehavi et al. (2004). |
8.3. Interpreting the Luminosity and Color Dependence of Galaxy Clustering
In general, these HOD parameters reflect the efficiency of galaxy formation
and evolution and can be a function of galaxy properties such as
luminosity, color, stellar mass, and morphology.
Zehavi et al. (2011)
present HOD fits to SDSS samples as a function of luminosity and color
and find that is
generally ~ 1.0-1.1, though it is a bit higher for the
brightest galaxies (~ 1.3 for Mr < -22.0).
There is a strong trend between luminosity and halo mass;
Mmin varies as a function of luminosity from
~ 1011 h-1
M for
Mr < -18 to ~ 1014 h-1
M for
Mr < -22.
M1 is generally ~ 17 times higher than the value of
Mmin for all luminosity threshold samples (see
Fig. 12). This implies that a halo with two
galaxies above a given luminosity is ~ 17 times more
massive than a halo hosting one galaxy above the same luminosity limit.
Further, the fraction of galaxies that are
satellites decreases at higher luminosities, from ~ 33% at
Mr < -18 to
4% at Mr < -22. The right panel of
Fig. 12 shows the mass-to-light ratio
of the virial halo mass to the central galaxy r-band luminosity
as a function of halo mass. This figure shows that halos of mass ~ 4
× 1011 h-1
M are
maximally efficient at galaxy formation, at converting baryons into light.
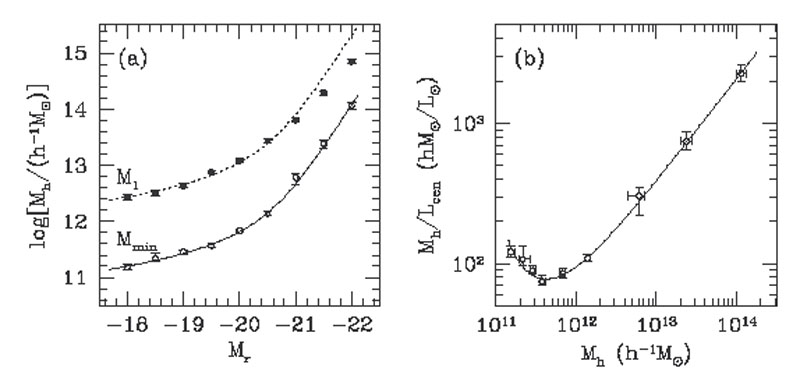 |
Figure 12. Left: The characteristic mass scale of dark matter halos hosting galaxies as a function of the luminosity threshold of the galaxy sample. Both the minimum halo mass to host a single galaxy is shown (Mmin) as well as the minimum mass to host additional satellite galaxies (M1). A strong relationship clearly exists between halo mass and galaxy luminosity. Right: The ratio of the halo mass to the median central galaxy luminosity as a function of halo mass. Taken from Zehavi et al. (2011). |
In terms of the color dependence of galaxy clustering,
the trend at fainter luminosities of red galaxies
being strongly clustered (with a higher correlation slope,
 , see
Fig. 8) is due to faint red galaxies
being satellite galaxies in relatively
massive halos that host bright red central galaxies
(Berlind et
al. 2005).
HOD modeling therefore provides a clear explanation for the increased
clustering observed for faint red galaxies.
For a given luminosity range (-20 < Mr < -19)
(Zehavi et al. 2011)
fit a simplified HOD model with one parameter only to find that the
fraction of galaxies that are satellites is much higher for red than for
blue galaxies, with ~ 25% of blue galaxies being satellites and ~ 60% of
red galaxies being satellites.
They find that blue galaxies reside in halos with a median mass of
1011.7 h-1
M, while
red galaxies reside in higher mass halos with a median
mass of 1012.2 h-1
M.
However, at a given luminosity, there is not a strong
trend between color and halo mass (though there is a strong trend between
luminosity and halo mass). Instead, the differences in
wp(rp) reflect a
trend between color and satellite fraction; the increased satellite
fraction, in particular, drives the slope of
(r) to be
steeper for red galaxies compared to blue galaxies. And while the HOD slope
, does not
change much with increasing luminosity, it does with color, due to the
dependence of the satellite fraction on color.
Having a higher satellite fraction also places more galaxies in high
mass halos (as those host the groups and clusters
that contain the satellite galaxies), which increases the large scale bias
and boosts the one halo term relative to the two halo term.
The HOD model facilitates interpretion of the observed luminosity and color
dependence of galaxy clustering and provides strong, crucial constraints
on models of how galaxies form and evolve within their parent dark
matter halos.
, see
Fig. 8) is due to faint red galaxies
being satellite galaxies in relatively
massive halos that host bright red central galaxies
(Berlind et
al. 2005).
HOD modeling therefore provides a clear explanation for the increased
clustering observed for faint red galaxies.
For a given luminosity range (-20 < Mr < -19)
(Zehavi et al. 2011)
fit a simplified HOD model with one parameter only to find that the
fraction of galaxies that are satellites is much higher for red than for
blue galaxies, with ~ 25% of blue galaxies being satellites and ~ 60% of
red galaxies being satellites.
They find that blue galaxies reside in halos with a median mass of
1011.7 h-1
M, while
red galaxies reside in higher mass halos with a median
mass of 1012.2 h-1
M.
However, at a given luminosity, there is not a strong
trend between color and halo mass (though there is a strong trend between
luminosity and halo mass). Instead, the differences in
wp(rp) reflect a
trend between color and satellite fraction; the increased satellite
fraction, in particular, drives the slope of
(r) to be
steeper for red galaxies compared to blue galaxies. And while the HOD slope
, does not
change much with increasing luminosity, it does with color, due to the
dependence of the satellite fraction on color.
Having a higher satellite fraction also places more galaxies in high
mass halos (as those host the groups and clusters
that contain the satellite galaxies), which increases the large scale bias
and boosts the one halo term relative to the two halo term.
The HOD model facilitates interpretion of the observed luminosity and color
dependence of galaxy clustering and provides strong, crucial constraints
on models of how galaxies form and evolve within their parent dark
matter halos.
8.4. Interpreting the Evolution of Galaxy Clustering
As mentioned in Section 7 above, the galaxies that are observed for clustering measurements at different redshifts are not necessarily the same populations across cosmic time. A significant hurdle in understanding galaxy evolution is knowing how to connect different observed populations at different redshifts. Galaxy clustering measurements can be combined with theoretical models to trace observed populations with redshift, in that for a given cosmology one can model how the clustering of a given population should evolve with time.
The observed evolution of the luminosity-dependence of galaxy clustering can be fit surprisingly well using a simple non-parametric, non-HOD, model that relates the galaxy luminosity function to the halo mass function. Conroy et al. (2006) show that directly matching galaxies as a function of luminosity to host halos and subhalos as a function of mass leads to a model for the luminosity-dependent clustering that matches observation from z ~ 0 to z ~ 3. In this model, the only inputs are the observed galaxy luminosity function at each epoch of interest and the dark matter halo (and subhalo) mass function from N-body simulations. Galaxies are then ranked by luminosity and halos by mass and matched one-to-one, such that lower luminosity galaxies are associated with halos of lower mass, and galaxies above a given luminosity threshold are assigned to halos above a given mass threshold with the same abundance or number density. This "abundance matching" method uses as a proxy for halo mass the maximum circular velocity (Vmax) of the halo; for subhalos they find that it is necessary to use the value of Vmax when the subhalo is first accreted into a larger halo, to avoid the effects of tidal stripping. With this simple model the clustering amplitude and shape as a function of luminosity are matched for SDSS galaxies at z ~ 0, DEEP2 galaxies at z ~ 1, and Lyman break galaxies at z ~ 3. In particular, the clustering amplitude in both the one and two halo regimes is well fit, including the deviations from a power law that seen at z > 1 (Ouchi et al. 2005, Coil et al. 2006). These results imply a tight correlation between galaxy luminosity and halo mass from z ~ 0 to z ~ 3.
While abundance-matching techniques provide a simple, zero parameter model for how galaxies populate halos, a richer understanding of the physical properties involved may be gained by performing HOD modeling. Zheng et al. (2007) use HOD modeling to fit the observed luminosity-dependent galaxy clustering at z ~ 0 measured in SDSS with that measured at z ~ 1 in DEEP2 to confirm that at both epochs there is a tight relationship between the central galaxy luminosity and host halo mass. At z ~ 1 the satellite fraction drops for higher luminosities, as at z ~ 0, but at a given luminosity the satellite fraction is higher at z ~ 0 than at z ~ 1. They also findthat at a given central luminosity, halos are ~ 1.6 times more massive at z ~ 0 than z ~ 1, and at a given halo mass galaxies are ~ 1.4 times more luminous at z ~ 1 than z ~ 0.
Zheng et al. (2007)
further combine these HOD results with theoretical predictions of
the growth of dark matter halos from simulations to link z ~ 1
central galaxies to their descendants at z ~ 0 and find that the
growth of both halo mass and stellar mass as a function of redshift
depends on halo mass. Lower mass halos grow
earlier, which is reflected in the fact that more of their z ~ 0
mass is already assembled by z ~ 1. A typical z ~ 0 halo
with mass 3 × 10¹¹ h-1
M has
about 70% of its final mass in place by z ~ 1,
while a z ~ 0 halo with mass 1013 h-1
M has ~
50% of its final mass in place at z ~ 1. In terms of stellar
mass, however, in a z ~ 0 halo of mass 5 × 10¹¹
h-1
M a
central galaxy has
~ 20% of its stellar mass in place at z ~ 1, while the fraction
rises to ~ 33% above a halo mass of 2 × 10¹²
h-1
M. They
further find that the mass scale of the maximum star formation efficiency
for central galaxies shifts to lower halo mass with time, with a peak of
~ 1012 h-1
M at
z ~ 1 and ~ 6 × 10¹¹ h-1
Mat
z ~ 0.
At 1 < z < 2,
Wake et al. (2011)
use precise photometric redshifts from the NEWFIRM survey to measure the
relationship between stellar mass and dark matter halo mass using HOD
models. At these higher redshifts r0 varies from ~ 6
to ~ 11 h-1 Mpc for stellar masses ~ 1010
M to
1011
M. The
galaxy bias is a
function of both redshift and stellar mass and is ~ 2.5 at z ~ 1
and increases to ~ 3.5 at z ~ 2. They find that the typical halo
mass of both central and satellite galaxies increases with stellar mass,
while the satellite fraction drops at higher stellar mass, qualitatively
similar to what is found at lower redshift. They do not find evolution
in the relationship between stellar mass and halo mass between z
~ 2 and z ~ 1, but do find evolution compared to z ~ 0.
They also find that the peak of star formation efficiency shifts to
lower halo mass with time.
Simulations can also be used to connect different observed galaxy
populations at different redshifts. An example of the power of this method
is shown by
Conroy et al. (2008),
who compare the clustering and space density
of star forming galaxies at z ~ 2
with that of star forming and quiescent galaxies at z = 1 and
z = 0 to infer both
the typical descendants of the z ~ 2 star forming galaxies and
constrain the fraction that have merged with other galaxies by z
= 0. They use halos and subhalos identified in a
CDM N-body
simulation to determine which halos at z ~ 2 likely host star
forming galaxies, and then use the merger histories in the simulation to
track these same halos to lower redshift. By
comparing these results to observed clustering of star forming galaxies at
z ~ 1 and z ~ 0 they can identify the galaxy populations
at these epochs that are consistent with being descendants of the
z ~ 2 galaxies. They find that while the lower redshift
descendent halos have clustering strengths similar to red galaxies at
both z ~ 1 and z ~ 0, the z ~ 2 star forming
galaxies can not all evolve into red galaxies by lower redshift, as their
space density is too high. There are many more lower redshift descendents
than there are red galaxies, even after taking into account mergers. They
conclude that most z ~ 2 star forming galaxies evolve into typical
L* galaxies today,
while a non-negligible fraction become satellite galaxies in larger galaxy
groups and clusters.
In summary, N-body simulations and HOD modeling can be used to interpret the observed evolution of galaxy clustering and further constrain both cosmological parameters and theoretical models of galaxy evolution beyond what can be gleaned from z~ 0 observations alone. They also establish links between distinct observed galaxy populations at different redshifts, allowing one to create a coherent picture of how galaxies evolve over cosmic time.