


Figure 6 illustrates our conclusion that, at
MV
 -18, the dwarf
spiral, Im, and Sph galaxies in earlier figures form a sequence of
decreasing baryon retention in smaller galaxies (KFCB;
Kormendy & Bender
2012;
Kormendy & Freeman
2014).
In contrast, bulges and ellipticals together form a sequence of
increasing dissipation during the formation of smaller galaxies.
For MV < -18 galaxies of all kinds, effective
densities in stars are similar to DM densities at and
interior to the same radius. For Sc-Im systems, this is by construction
a consequence (1) of using maximum-disk
decompositions and (2) of the "rotation curve conspiracy"
(van Albada &
Sancisi 1986),
i.e., the observation that rotation curves of giant galaxies are roughly
flat and featureless, so the parts of galaxies
that are controlled by dark matter are not easily distinguished from the
parts that are controlled by visible matter or even the parts that are
controlled by different components in the visible matter
(Figure 4). Caveat:
for bulges and ellipticals, high baryon densities at r ≪
re may pull on DM halos enough to
increase their central densities over the values for Sc-Im galaxies that
are shown in Figure 6.
But bulges and ellipticals have central projected densities that
are more than 3 dex higher than
the effective densities shown in Figure 6. So
the central parts of early-type galaxies are very
baryon-dominated. Even the central densities of disks are 0.7 dex (for
an exponential) higher than the effective densities shown in
Fig. 6. So even pure disks are moderately
dominated by visible matter near their centers. Both results are
qualitatively as expected: Visible matter needs to dissipate,
sink inside the DM, and become self-gravitating enough to form stars and
visible galaxies. And a great deal of dissipation happens in the wet
mergers that make normal ellipticals (KFCB): their densities
rise above DM densities by larger amounts at fainter MV.
-18, the dwarf
spiral, Im, and Sph galaxies in earlier figures form a sequence of
decreasing baryon retention in smaller galaxies (KFCB;
Kormendy & Bender
2012;
Kormendy & Freeman
2014).
In contrast, bulges and ellipticals together form a sequence of
increasing dissipation during the formation of smaller galaxies.
For MV < -18 galaxies of all kinds, effective
densities in stars are similar to DM densities at and
interior to the same radius. For Sc-Im systems, this is by construction
a consequence (1) of using maximum-disk
decompositions and (2) of the "rotation curve conspiracy"
(van Albada &
Sancisi 1986),
i.e., the observation that rotation curves of giant galaxies are roughly
flat and featureless, so the parts of galaxies
that are controlled by dark matter are not easily distinguished from the
parts that are controlled by visible matter or even the parts that are
controlled by different components in the visible matter
(Figure 4). Caveat:
for bulges and ellipticals, high baryon densities at r ≪
re may pull on DM halos enough to
increase their central densities over the values for Sc-Im galaxies that
are shown in Figure 6.
But bulges and ellipticals have central projected densities that
are more than 3 dex higher than
the effective densities shown in Figure 6. So
the central parts of early-type galaxies are very
baryon-dominated. Even the central densities of disks are 0.7 dex (for
an exponential) higher than the effective densities shown in
Fig. 6. So even pure disks are moderately
dominated by visible matter near their centers. Both results are
qualitatively as expected: Visible matter needs to dissipate,
sink inside the DM, and become self-gravitating enough to form stars and
visible galaxies. And a great deal of dissipation happens in the wet
mergers that make normal ellipticals (KFCB): their densities
rise above DM densities by larger amounts at fainter MV.
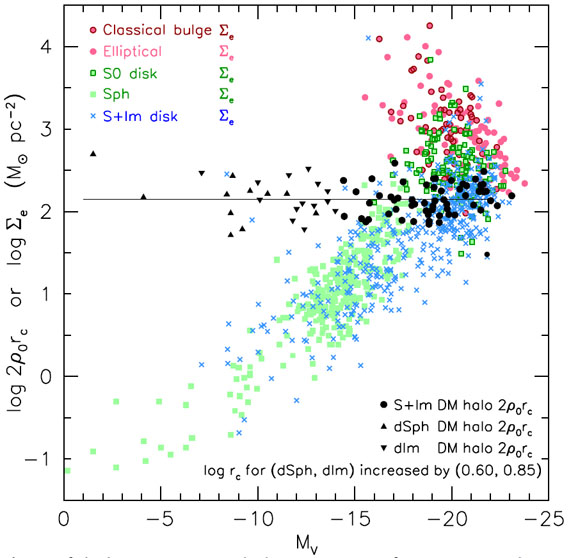 |
Figure 6. Comparison of dark matter (DM) halo parameters from Kormendy & Freeman (2014) with visible matter parameters from Kormendy & Bender (2012). DM parameters are from maximum-disk rotation curve decompositions (black circles) or from cored isothermal halo models applied to the dispersion profiles of dSph galaxies (black triangles) or to the V ∝ r rotation curves and velocity dispersions of HI in dIm galaxies (upside-down black triangles) (see Kormendy & Freeman 2014, the source of this figure). Central projected densities are plotted for DM halos; effective surface densities Σe = Σ(re) are shown for visible components. Here re is the radius that contains half of the light of the component. Surface brightnesses are converted to stellar surface densities using mass-to-light ratios M / LV = 8 for ellipticals, 5 for classical bulges and S0 disks, and 2 for spiral galaxy disks, Im galaxies, and Sph galaxies. |
The important point here is this: At MV > -18,
tinier dwarfs are more DM dominated, until by
MV
-10, they are
essentially dark galaxies with just enough of a frosting of stars so
that they can be detected. I emphasize two important
points: (1) The differences between dIm and dSph galaxies in all
parameter correlations shown in this paper are
small. Whether or not a galaxy retains cold gas and can still form stars
in today's Universe is a second-order effect. This argues - as
Dekel & Silk (1986)
already emphasized - that the primary effect that engineers the
parameter correlations is supernova-driven baryon blowout or another
process (such as a failure to capture baryons
before cosmic reionization) that has the same effect. (2)
Kormendy & Freeman
(2014)
suggest that there exists a large population of tiny halos that
are essentially completely dark and that the discoverable galaxies at
MV
-13 represent a
smaller and smaller fraction of tinier DM halos. This has been suggested
as the solution to the problem that the fluctuation spectrum of cold
dark matter predicts more dwarfs than are observed in environments like
the Local Group (e.g.,
Moore et al. 1999;
Klypin et al. 1999).