Copyright © 2014 by Annual Reviews. All rights reserved
| Annu. Rev. Astron. Astrophys. 2014. 52:
Copyright © 2014 by Annual Reviews. All rights reserved |


The power of far-infrared emission as star formation indicator simply relies on the total infrared emission, but the detailed shape of the spectral energy distribution of a galaxy encodes the conditions in the interstellar medium in which the emitting dust grains reside. A dust grain will equilibrate to a temperature that increases with the intensity of the local radiation field. Since the grain's re-emission scales with Tdust4+β and the dust emissivity index is β = 1.5-2, few K variations around dust temperatures of typically 30 K already reflect significant variations in the average radiation field. Dust heating is a local process that is dependent on the spatial distribution of the heating sources and the dust (acting both as heated and obscuring material), but strongly simplified assumptions can give insights for possible scalings. Compact high pressure and high radiation field intensity star formation regions in the nuclear regions of galaxy mergers will have warmer dust. Such a link between size and temperature can however not be extended to the total size of a galaxy if temperature is driven by the conditions in localized star forming regions, of which more or less may be present in a galaxy's disk but with similar conditions in each. Another simple assumption is to consider the dust as a calorimeter that re-emits the total radiation from young stars. The temperature then reflects the ratio of SFR to dust mass, keeping the ratio of SFR and gas mass fixed (plasible in regimes with a near-linear star formation law), lower metallicity galaxies with lower dust-to-gas ratios will then have warmer dust.
The dust temperature will also depend on the grain's optical properties as driven by chemical composition, size, and structure. Its emission at this temperature again depends on optical properties via the wavelength-dependent emissivity. Small grains are transiently heated by individual photons, to higher than equilibrium temperature. Such transient heating is important for the continuum on the short wavelength (Wien) side of the far-infrared SED peak, and in particular for the mid-infrared `PAH' emission features which reflect the aromatic nature of their carriers. An example of a current model of interstellar dust reflecting these considerations is Draine & Li (2007). Warmer far-infrared SEDs or colors thus reflect a more intense radiation field, via a long chain involving the properties of the mixed grain population. Additional complication arises because the dust emission may not be optically thin as implicitly assumed above and valid for normal galaxies, but optically thick into the far-infrared. Comparing infrared luminosities, SED temperatures, and sizes to the Stefan-Boltzmann law for blackbodies suggests this is an issue for the most compact local ULIRGs. In contrast, attempts to infer the wavelength of optical thickness from fits to high redshift SEDs should be seen with some skepticism, given that photometric coverage and SNR are typically limited, and the assumptions on the intrinsic SED are often simplified.
Caution is warranted when comparing dust temperatures from different references, since a range of conventions is in use in assigning a single temperature to a complex SED. Most often, dust temperatures are derived by fitting the photometric data with a variant of the modified blackbody function Sν ∝ Bν(Tdust)(1-e-τν) with a wavelength dependent optical depth τν = τ(ν0)(ν / ν0)β. For a given set of fluxes, the derived dust temperature Tdust will depend on the adopted dust emissivity index β (typically assumed to be 1.5-2), and on adoption of an optically thin model versus a model that is optically thick below some frequency ν0 (which may be fitted to the data or adopted as a fixed value). Finally, the rest wavelength range included will influence Tdust since galaxy SEDs deviate from the single modified blackbody especially on the Wien side of the peak, due to hotter dust and/or transiently heated dust grains. Differences in nominal Tdust of order 10 K can emerge from different conventions. This is significant for typical Tdust = 30 K, and relevant given the good quality and rest frame coverage of current data. Further modifications in use include (1) fits with modified blackbodies at several discrete temperatures or with a power law distribution of temperatures, (2) fits with modified blackbodies joined with a power law on the Wien side, and (3) use of peak wavelengths or frequencies in the fitted SED, converted to a `temperature' via Wien's displacement law.
In the local universe, an extensively studied relation exists between the infrared luminosity of a galaxy and its far-infrared color or dust temperature - local IR luminous galaxies with their high star formation rates arising in often small regions show warmer dust (e.g. Chapin, Hughes & Aretxaga 2009, Hwang et al. 2010 and references therein). Herschel data permit to test whether this LIR - Tdust relation evolves with redshift, and how the findings relate to the current picture of high z galaxies in the context of the evolving star forming sequence.
3.1. Evolution of infrared spectral energy distributions with redshift
As discussed in the context of the use of the mid infrared emission as star formation indicator (Section 2.2), there is an evolution with redshift in the ratio of rest frame 8 μm PAH emission and total infrared emission. At given IR luminosity, high-z galaxies have relatively stronger PAH, than local ULIRG mergers. This indicates that they have less intense local radiation fields (e.g. Tielens 2008).
The other main line of studies addresses the dust temperature which is characterizing the rest far-infrared peak. Care is needed due to the common presence of selection effects. In particular SMGs from ground based 850 μm surveys were long expected to be biased towards cold objects. This is confirmed by Herschel (Section 4.3) - there are warmer objects at the same z and LIR that escape the SMG selection. Selection effects certainly also contribute to lower dust temperature and larger dust mass when comparing z < 0.5 250 μm-selected galaxies and local IRAS selected samples (Smith et al. 2012).
Herschel selection near the SED peak is less biased. In a first comparison of z > 0.5 Herschel detections with local galaxies which have SED coverage out to 160 μm from Akari, Hwang et al. (2010) conclude that the median Tdust of LIR > 5 × 10¹⁰ L⊙ Herschel sources is 2-5 K colder than that of local galaxies with similar luminosity, and that the dispersion in dust temperature is larger in the Herschel sample. Such a shift to colder SEDs at higher redshift but equivalent IR luminosity is also reported by Rex et al. (2010). Symeonidis et al. (2013) address this issue using a very large SPIRE and PACS dataset. Based on comparison to a wide grid of model SEDs, they restrict the luminosity and redshift range studied to carefully ensure absence of selection effects on the dust temperature. At the z ≳ 1 LIR ≳ 1012 L⊙ upper end of the range studied, SEDs are 5-10 K colder than for local sources of equivalent luminosity (Figure 7). High redshift galaxies have lower average interstellar radiation field intensities than their same luminosity local analogs, reflecting more extended star formation.
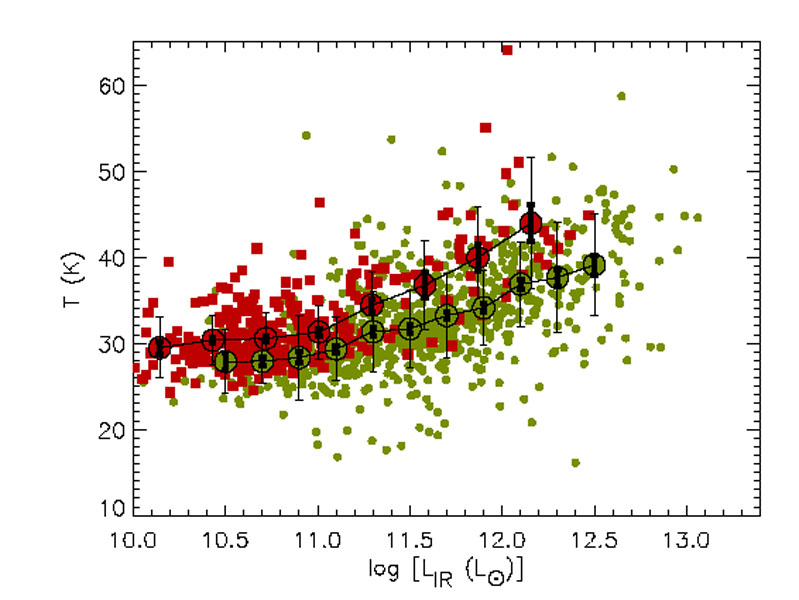 |
Figure 7. LIR - Tdust relation for local z < 0.1 galaxies (red squares) and for a Herschel sample (green circles), representing redshifts from z ~ 0.2 to z ~ 1.5 as IR luminosity increases. Reproduced from Fig. 18 of Symeonidis et al. (2013). |
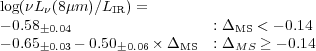
Placing the infrared SED in the context of the basic parameters stellar mass, star formation rate, and redshift, Magnelli et al. (2014) derive average dust temperatures from stacked SEDs in bins gridding the SFR - M∗ plane for six redshift slices out to z ~ 2. They derive scaling relations for the dust temperature as a function of these parameters. At all redshifts, Tdust smoothly increases with IR luminosity, with specific star formation rate, and with specific star formation rate offset from the star forming main sequence. The classical relation of dust temperature with IR luminosity is less tight than the other two, however, as also evident in the sloped iso-temperature lines in the SFR - M∗ planes for the various redshift slices (example in bottom right of Fig. 8). Dust temperature is better expressed in relation to the evolving main sequence than in relation to absolute IR luminosity. The scalings derived by Magnelli et al. (2014) for massive z ≲ 2 star forming galaxies as a function of redshift and SSFR, and as a function of redshift and SSFR offset from the main sequence are:
 |
 |
with similar quality of the two scalings. For normal star forming galaxies on the star forming main sequence, both Magdis et al. (2012a) and Magnelli et al. (2014) report a slow increase of dust temperature (radiation field intensity) with redshift. In a simple scenario where dust temperature is directly linked to the ratio of SFR to dust mass as an approximation to radiation field intensity, this may be linked to a combination of a decrease in molecular gas depletion times MMol / SFR ∝ (1 + z)-1 (Tacconi et al. 2013) and a decrease in metallicity, for main sequence galaxies at increasing redshift. Such trends should then continue to regimes that are not covered by Herschel blank fields surveys. Indeed, for an optically selected sample of gravitationally lensed z = 1.4-3.1 M* ~ 1010 M⊙ near main-sequence galaxies that would be too faint for an SED study in blank fields, Saintonge et al. (2013) report rather warm dust temperatures of order 50 K, plausibly linked to their short gas depletion times MMol / SFR and their low metallicity.
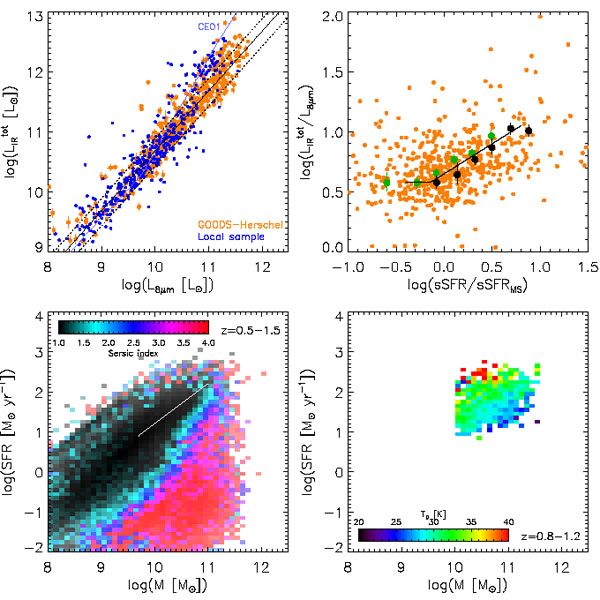 |
Figure 8. Changes in infrared SEDs of galaxies and their relation to the evolving star forming sequence. Top left: Total infrared vs. 8 μm luminosity for a local sample (blue dots) and a z ≲ 2.5 Herschel sample (orange dots, diagonal lines visualize median ratio and dispersion for this sample). The blue line shows the locus traced by the Chary & Elbaz (2001) local SED library. Figure adapted from Elbaz et al. (2011). Top right: Relation between the offset in specific SFR from the evolving main sequence (`starburstiness') and the ratio of total infrared and 8 μm luminosity. The high-z sample of Elbaz et al. (2011) is shown in orange. Average values from Nordon et al. (2012) are plotted for z ~ 1 (green) and z ~ 2 (black), along with their proposed redshift-independent relation (black, their Equation 3). Bottom left: Median Sersic indices for galaxies in the z ~ 1 starformation rate - stellar mass plane. Low values indicating preference for disk morphologies are found near the main sequence which is qualitatively located by the white line (adapted from Wuyts et al. 2011b). Bottom right: Mean temperature of dust in the z ~ 1 SFR - stellar mass plane (adapted from Magnelli et al. 2014). |
Magdis et al. (2011b) explore whether deep Herschel surveys uncover a qualitatively new population of galaxies, that is missing in even very deep mid-infrared Spitzer data. Indeed there is a small ~ 2% fraction of GOODS-S field PACS sources that are undetected even in the deepest 24 μm data. According to spectroscopic or optical/NIR photometric redshifts, these are found to cluster around redshifts z ~ 0.4 and z ~ 1.3 where the 24 μm band can drop out due to strong silicate absorption. These sources are similar to other compact and obscured starbursts among the sources that are detected at both mid- and far-infrared wavelengths.
3.1.1. FAR-INFRARED PHOTOMETRIC REDSHIFTS FOR LARGE SAMPLES Identifications and redshifts are relatively easily secured for z ≲ 2.5 Herschel galaxies in the best studied fields with deep multiwavelength imaging in particular from Spitzer, and with rich sets of spectroscopic and photometric redshifts. Spectroscopic completeness of ~ 70% and essentially complete optical/NIR photometric redshifts are in hand for PACS sources in the best fields like GOODS-S. For higher redshifts and in the largest fields with less complete multiwavelength data, it is of interest to directly estimate redshifts for large samples, without a need for identifying counterparts in deep optical/NIR imaging. This is analogous to earlier radio-submillimeter-infrared attempts for submillimeter galaxies (e.g. Carilli & Yun 2000, Aretxaga et al. 2007, Daddi et al. 2009). The observed SED peak wavelength can be well measured for large numbers of SPIRE/PACS detected sources, but conversion into a redshift estimate is subject to the well known Tdust - z degeneracy. Given the scatter and evolution with redshift of dust temperature even at given IR luminosity, this is a significant limitation. Specifically, in z ≲ 1 flux limited samples selection effects can conspire to leave very little evolution in the median observed peak wavelength, as shown on the basis of a spectroscopic redshift survey of SPIRE sources by Casey et al. (2012).
A variety of approaches to Herschel photometric redshifts based on rest frame far-infrared data has been reported (e.g. Amblard et al. 2010, Dannerbauer et al. 2010, Lapi et al. 2011), with an average accuracy of (1 + zphot) / (1 + zspec) ~ 10% in the best reported case (Chakrabarti et al. 2013). Calibration datasets are often biased towards sources with previous groundbased (sub)mm detections and redshifts, in some cases the method encodes the LIR - Tdust relation of SMGs which is biased towards low Tdust for low infrared luminosities (Roseboom et al. 2012). Further validation is clearly needed. While Herschel SEDs can provide first redshift estimates at z ≳ 1 or help resolve significant ambiguities in photometric redshifts that are based on other wavelengths, their use for any analysis that needs high quality photometric redshifts should be seen with caution.
An independent route towards a redshift distribution of Herschel sources has been explored by Mitchell-Wynne et al. 2012. Spatially cross-correlating galaxy samples selected at 250 to 500 μm with larger samples selected at optical and near-infrared wavelengths and with known redshift distributions, they infer redshift distributions for the Herschel sources with mean <z> = 1.8...1.9 and broadly consistent with other evidence. Uncertainties are currently large but may improve with inclusion of a larger fraction of the existing Herschel data.
3.2. Infrared galaxies in relation to the star forming main sequence
Over the last years, star forming galaxies out to at least z ~ 2 have been shown to follow a relation between star formation rate and stellar mass, dubbed the `star forming sequence' or `main sequence of star formation' (e.g. Brinchmann et al. 2004, Noeske et al. 2007, Elbaz et al. 2007, Daddi et al. 2007). Starburst galaxies rise to higher star formation rates above this sequence, and a population of passive galaxies is found at low star formation rates, in analogy to the divison of galaxies into red sequence and blue cloud in color-magnitude diagrams. The star forming sequence is rather tight with a dispersion of ~ 0.3 dex, and star formation rate increases with stellar mass with a power law SFR ∝ M*p with slope p ~ 0.6-1. Most importantly, star formation rates of galaxies on this sequence increase with redshift with (S)SFR ∝ (1 + z)2.5-3 to z ~ 2, with a possible flattening at higher redshift (e.g. González et al. 2010, but note ongoing discussion). The existence and tightness of the sequence argue for rather steady star formation histories. This has contributed to the ongoing reassessment of the roles in the driving of star formation that are ascribed to more steady processes such as gas inflow from the cosmic web and minor mergers, versus dramatic major mergers. Here, a close link exists to the finding that many z ~ 1-2 massive star forming galaxies are (clumpy) disk galaxies (e.g. Förster Schreiber et al. 2009), with large molecular gas fractions (e.g., Daddi et al. 2010, Tacconi et al. 2010, Tacconi et al. 2013).
The SFR limits of large area Herschel surveys reach the main sequence only at its ≳ 1011M ⊙ tip and create samples dominated by starbursts above the sequence. While such surveys provide important statistics for luminous objects, attempts to identify the main sequence from such data alone fail (e.g. Lee et al. 2013). Studying main-sequence objects at lower masses requires the deepest Herschel data e.g. from the GOODS fields, or combination with other star formation indicators, or Herschel stacking of star formation samples selected at other wavelengths.
Most star formation happens on the star forming sequence. Combining Herschel SFRs for strongly star forming galaxies with optical/NIR data for BzK galaxies with lower star formation rates, Rodighiero et al. (2011) estimate that only 10% of the z ~ 2 SFR density is due to objects with SSFRs more than a factor 4 above the main sequence (Figure 9). In numbers, only 2% of z ~ 2 star forming galaxies are found above this threshold. With different parametrisation (two overlapping Gaussian components rather than a threshold separating main sequence and starbursts) the outlying starbursts may contribute ~ 20% of the star formation density (Sargent et al. 2012). Such a predominant role for the star forming sequence is similar to what is suggested by observations in the local universe (e.g. Brinchmann et al. 2004).
 |
Figure 9. Distribution of specific star formation rates for several mass bins in a sample of star forming galaxies at 1.5 < z < 2.5. Star formation rates are from Herschel for high SFR sources in COSMOS (red) and GOODS-S (cyan), and from dust-corrected UV emission for BzK galaxies in GOODS-S (dotted black) and COSMOS (solid black). The green curves show the Gaussian fits to the black solid histograms, with the main sequence location at the vertex indicated by the green dashed line. The black dashed lines are 0.6 dex above the main sequence and show the adopted separation between main sequence and starbursts that are off the sequence. Reproduced from Figure 2 of Rodighiero et al. (2011). |
Elbaz et al. (2011) find that at given IR luminosity, the ratio ν Lν(8 μm) / LIR increases with redshift (i.e. its inverse, dubbed IR8 by Elbaz et al. (2011), decreases), causing the mid-infrared excess that affected previous mid-IR based star formation rate estimates (Section 2.2). Elbaz et al. (2011) systematically study this ratio for both a 0 < z < 2.5 Herschel sample and a local reference sample of star forming galaxies (Figure 8 top left). In both samples, the distribution of IR8 is characterised by a prominent Gaussian-like peak centered near IR8 ~ 4, and a tail towards larger values (weaker PAH emission). The peak can be identified with the main sequence of star forming galaxies. In particular for the well-studied local sample, the tail towards larger IR8 is shown to represent compact starbursts of high IR surface brightness and high specific star formation rate. Changes of IR8 can be related to the main sequence in a way that is consistent over 0 < z ≲ 2.5. This can be done as two fixed ratios for main sequence objects and for starbursts above the main sequence, separated at IR8=8 and with IR8=5 and IR8=11 for the derived main sequence and starburst spectral templates (Elbaz et al. 2011). Alternatively, ν Lν(8 μm) / LIR can be expressed as a steady function of the SSFR offset from the main sequence (Nordon et al. 2012):
 |
(1) |
where ΔMS = log(SSFR) - log(SSFRMS) is the specific star formation rate offset from the main sequence (Gyr-1) (Fig. 8 top right. Galaxies with a similar ratio ν Lν(8 μm) / LIR tend to lie along lines of constant logarithmic SSFR offset from the main sequence in the z ~ 1 and z ~ 2 samples of Nordon et al. (2012).
The link of these findings to size and morphology is emphasized by the study of Wuyts et al. (2011b) who use a hierarchy of star formation rates from Herschel, Spitzer and UV-optical-NIR SED fitting to place large samples of z ~ 0.1 to z ~ 2.5 galaxies on the SFR-mass plane and study their HST morphologies. In a median sense, main sequence galaxies show the largest sizes at a given stellar mass, as well as disk-like Sersic indices, while quiescent galaxies as well as starbursts in the upper envelope of the main sequence prefer higher Sersic indices. The starbursts may be in the process of building up central mass concentrations. Interestingly, disk-like morphologies provide a tracing of the main sequence (Fig. 8 bottom left) that is independent of the original identification of the star forming main sequence via the correlation of star formation and stellar mass for star forming galaxies. The morphology trends reported by Wuyts et al. (2011b) refer to the median in a certain SFR, M∗, z bin. This leaves room for a mix of disk and merger morphologies within such a bin. Reliable quantification of such fractions is affected by the well known intricacies of accurately distinguishing clumpy single objects from mergers, if using broadband morphological information only.
Concerning the rest frame far-infrared peak, high redshift starbursts above the main sequence show increased dust temperatures (Elbaz et al. 2011, Magdis et al. 2012b, Magnelli et al. 2014). This is analogous to the difference between warm (U)LIRGs and cold lower luminosity disk galaxies in the local universe. As discussed above, when looking at a broader redshift range dust temperature can be expressed as a function of main sequence offset with less scatter and less redshift dependence compared to expressing temperature as a function of IR luminosity only.
Another key ISM diagnostic is the rest frame far-infrared fine structure lines. The [CII] 158 μm line, the main interstellar medium cooling line under many conditions, is known since early airborne detections and the ISO mission to show a deficit (decreased [CII]/LIR ratio) in local ULIRGs (e.g., Malhotra et al. 2001, Luhman et al. 2003 and references therein). Decreased photoelectric heating efficiency in intense radiation fields and dust-bounded HII regions likely play a role in shaping this trend. Herschel high redshift detections of this line are difficult, but large ground based submm telescopes are stepping in to provide detections, a field that is about to expand vastly with ALMA. At given IR luminosity, high redshift galaxies typically show larger [CII]/LIR than local objects (e.g. Maiolino et al. 2009, Stacey et al. 2010, Rigopoulou et al. 2014). While many of these targets cannot yet be located with respect to the main sequence, due to lack of reliable stellar masses, Graciá-Carpio et al. (2011) combine such literature high-z [CII] detections with local Herschel measurements. They find that the difference between [CII] deficit at low and high z largely disappears if the deficit is plotted as a function of LIR / MMol rather than LIR. This ratio of IR luminosity and molecular gas mass is a proxy to offset from the main sequence. Graciá-Carpio et al. (2011) find that sources showing a deficit in [CII] and also in other far-infrared fine structure lines are found at LFIR / MH2 ≳ 80 L⊙ M⊙-1.
To summarize these findings for massive M∗ ≳ 1010 M⊙ star forming galaxies: For a wide set of interstellar medium diagnostics (PAH emission, far-infrared dust temperature, fine structure line emission) as well as morphology, which are all known to locally follow well characterised trends with infrared luminosity from disk galaxies to merger ULIRGs, the main sequence paradigm seems to provide a better and more consistent reference to express properties in a redshift independent way. Star formation in main sequence galaxies appears to occur in a similar mode at all redshifts, despite a variation in (S)SFR of more than a factor 20 for main sequence galaxies over the redshift range studied. Compression of the gas content for example in major mergers changes the ISM conditions and enhances the specific star formation rates of starbursts above the main sequence.