


One of the main goals of the EoR projects is to measure the power spectrum of variations in the intensity of redshifted 21 cm radiation from the EoR [10, 15, 134, 133, 226]. As shown in Equation 22 the power spectrum depends on a number of astrophysical and cosmological quantities. The sensitivity with which this power spectrum can be estimated depends on the level of thermal noise (Eq. 25), sample variance and systematic errors arising from the extraction process, in particular from the subtraction of foreground contamination. In the LOFAR case [78, 77, 95, 94, 103], for example, the extraction process is modeled using realistic simulations of the cosmological signal, the foregrounds and the noise. In doing so we estimate the sensitivity of the LOFAR EoR experiment to the redshifted 21 cm power spectrum. Detection of emission from the EoR should be possible within 300 hours of observation with a single station beam. Integrating for longer, and synthesizing multiple station beams within the primary (tile) beam, will then enable us to extract progressively more accurate estimates of the power at a greater range of scales and redshifts (see Figure 24 taken from [77]).
 |
Figure 24. Power spectra of the cosmic signal (blue solid line), the noise (red dashed line), the residuals (magenta dotted line) and the extracted signal (black points with error bars) at three different redshifts. Here the assumption is that, like in the real experiment, the uv coverage is frequency-dependent. Furthermore, the field is assumed to have been observed for 300 hours per frequency channel with a single station beam and the foreground fitting is done using the so called Wp method but performed in Fourier space [77]. |
Given the nature of the reionization process the expected signal is non-Gaussian, hence using high order statistics to characterize the data can reveal information that the power spectrum does not include. The left hand panel of Figure 25 shows the Probability Density Function (PDF) of the brightness temperature at four different redshifts; the PDF is clearly non Gaussian in all four cases. Therefore, high order moments, like the skewness, as a function of redshift could be a useful tool for signal extraction in the presence of realistic overall levels of foregrounds and noise. Harker et al [79], (see also [72, 89]) has shown that the cosmological signal, under generic assumptions, has a very characteristic pattern in the skewness as a function of redshift (the right hand panel of Figure 25). At sufficiently high redshifts the signal is controlled by the cosmological density fluctuations which, in the linear regime, are Gaussian. At lower redshifts, and as nonlinearity becomes important, the signal starts getting a slightly positive skewness. As the ionization bubbles begin to show up the skewness starts veering towards 0 until it crosses to the negative side when the weight of the ionized bubbles becomes more important than the high density outliers –note high density outliers are likely to ionize first– but the distribution is still dominated by the density fluctuations. At lower redshifts the bubbles dominate the PDF and the neutral areas become the "new" outliers giving rise to a sharp positive peak to the skewness. At redshift around 6 the instrument noise, assumed to be Gaussian, dominates driving the skewness again towards zero. Exploiting this characteristic behavior might allow us to pick up the cosmological signal with this high order statistic.
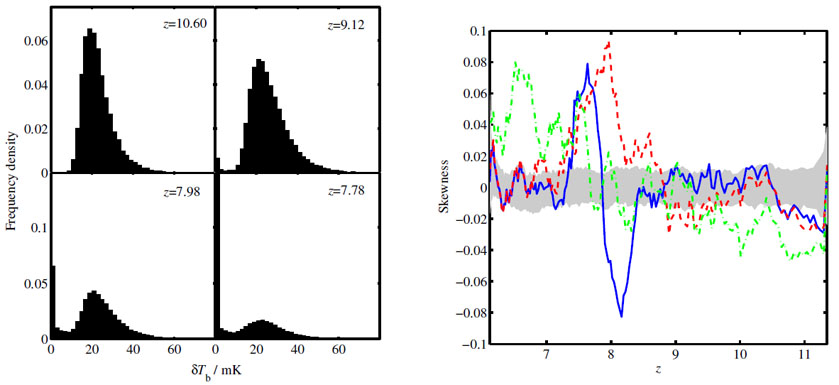 |
Figure 25. Left hand panel: The
distribution of
|
6.3. Cross-correlating the LOFAR-EoR data with other data sets
Given the challenges and uncertainties involved in measuring the redshifted 21cm signal from the EoR, it is vital to corroborate this result with other probes of the EoR. Namely, other astrophysical data that probe the EoR signal. The list of such data is long but here we focus on the most promising two such probes: CMB maps and high redshift galaxy catalogs.
The CMB photons are scattered by the free electrons released during the reionization process. This scattering produces anti-correlation between the CMB signal and the EoR through a number of physical processes. This has been studied in recent years by a number of groups [7, 3, 47, 95, 93, 174, 197, 198, 199]. Figure 26 shows a slice through reionization history of the 21cm signal (top panel) and the so called kinematic Sunyaev-Zeldovich effect which reflects the effect of reionization on the CMB photons (bottom panel) as time evolves [148, 195, 193, 194]. Notice the clear anti-correlation between the two maps. However, whereas the 21cm data store the redshift information in them the actual CMB data do not, instead they are sensitive to an integral of the map in the bottom panel over time (redshift). In both cases many instrumental, foreground and background effects might hamper the anti-correlation analysis.
 |
Figure 26. A slice through a simulated reionization history of the the cosmological 21cm signal (top panel) and the so called kinematic Sunyaev-Zeldovich effect which reflects the effect of reionization on the CMB photons (bottom panel) as time evolves [148, 195, 193, 194]. The expected anti-correlation between the two phenomena is patently clear. Unfortunately however, the CMB data stores no redshift (time) information and the actual map that one gets is the integral of the lower panel over redshift (time), which will make the anti-correlation more challenging to detect. This Figure is taken from [93]. |
Of special interest here are the CMB data expected to be collected by the Planck satellite, which will have a resolution comparable to the LOFAR core and, since it is an all-sky survey, will probe the same regions as the LOFAR-EoR project.
The other interesting data will come from high z galaxies and
quasars. These objects harbor the sources of ionization and are located
at the center of the ionization bubbles. Hence, they are
expected to anti-correlate with the EoR signal. Currently, a large
amount of effort is being put into gathering possible galaxy candidates at
high redshifts, e.g.,
Lyman- emitters and Z, Y
and J-bands
drop outs, etc. Recent studies have shown that the anti-correlation
signal will be detectable provided the number of galaxies in the
regions with EoR observations is significant (e.g. see
[113]).
emitters and Z, Y
and J-bands
drop outs, etc. Recent studies have shown that the anti-correlation
signal will be detectable provided the number of galaxies in the
regions with EoR observations is significant (e.g. see
[113]).
 Tb in a
certain cosmological simulation of reionization
[
Tb in a
certain cosmological simulation of reionization
[