Copyright © 2012 by Annual Reviews. All rights reserved
| Annu. Rev. Astron. Astrophys. 2012. 50:531-608
Copyright © 2012 by Annual Reviews. All rights reserved |


The influx of new observations over the past decade has led to major improvements in the calibration and validation of diagnostic methods for measuring SFRs in galaxies. Whereas measuring uncertainties of factors of two or larger in SFRs were commonplace ten years ago, new diagnostics based on multi-wavelength data are reducing these internal uncertainties by up to an order of magnitude in many instances. These techniques have also reduced the impact of many systematic errors, in particular uncertainties due to dust attenuation, though others such as the IMF (§ 2.5) remain important limiting factors.
A detailed discussion of SFR diagnostics and their calibrations was given in K98, and here we highlight progress made since that review was published. In § 3.8, we compile updated calibrations for the most commonly used indices, based on updated evolutionary synthesis models and IMF compared to K98. The new challenges which come with spatially-resolved measurements of galaxies are discussed in § 3.9.
3.1. Star Counting and CMD Analysis
The most direct way to measure star formation rates is to count the number of identifiable stars of a certain age. Ideally, one would have reliable masses and ages for each star and the mean star formation rate would be given by
 |
(8) |
where N(M*, t*) is the number of stars in a mass bin characterized by mass M* and a lifetime bin (the time since formation) characterized by t*, and the star formation rate would be averaged over the longest value of t* in the sum. In practice, complete information is not available, and one needs to limit the allowed lifetimes to find the star formation rate over a certain period. In particular, for nearby clouds in the MW, nearly complete lists of young stellar objects (YSOs) with infrared excesses are available. If one assumes that the YSOs sample the IMF in a typical way, one can derive the mean mass of stars (⟨M*⟩), and the equation becomes
 |
(9) |
With currently favored IMFs, ⟨M*⟩ = 0.5 M⊙. The main source of uncertainty is in texcess, the duration of an infrared excess (§ 4.1).
For young clusters one can determine mean ages from fitting isochrones
to a color-magnitude diagram, and measure
 * assuming
coeval formation as long as some stars have not yet reached the main
sequence. Some clusters have measurements of stars down to very low masses
(e.g., the Orion Nebula Cluster,
Hillenbrand 1997),
but most need corrections for unseen low-mass stars.
For older clusters one can derive the total mass, but not (directly) the
duration of star formation, which has to be assumed.
* assuming
coeval formation as long as some stars have not yet reached the main
sequence. Some clusters have measurements of stars down to very low masses
(e.g., the Orion Nebula Cluster,
Hillenbrand 1997),
but most need corrections for unseen low-mass stars.
For older clusters one can derive the total mass, but not (directly) the
duration of star formation, which has to be assumed.
In principle similar techniques can be applied on a galaxy-wide basis. Beyond the Magellanic Clouds, current instruments cannot resolve individual YSOs in most regions, and as a result most studies of SFRs in galaxies are based either on measurements of massive O-type and/or Wolf-Rayet stars (see K98) or on measurements of the entire color-magnitude diagram (CMD). Considerable progress has been made recently in using spatially-resolved mapping of CMDs to reconstruct spatially and age-resolved maps of star formation in nearby galaxies. Many of these use the distribution of blue helium-burning stars in the CMD (e.g., Dohm-Palmer et al. 2002), but more recent analyses fit the entire upper CMDs to synthetic stellar populations to derive estimates of spatially resolved stellar age distributions with formal uncertainties (e.g., Dolphin 2002; Weisz et al. 2008). This technique does not have sufficient age resolution to determine accurate SFRs for ages less than ~10 Myr, but when applied to high quality datasets such as those which can be obtained with HST, they can provide sufficient age resolution to constrain the temporal behaviors and changes in the spatial distributions of formation over the past 100 Myr or longer (e.g., Weisz et al. 2008; Williams et al. 2011).
3.2. Ultraviolet Continuum Measurements: The Impact of GALEX
The near-ultraviolet emission of galaxies longward of the Lyman-continuum break directly traces the photospheric emission of young stars and hence is one of the most direct tracers of the recent SFR. For a conventional IMF, the peak contribution to the integrated UV luminosity of a young star cluster arises from stars with masses of several solar masses. Consequently this emission traces stars formed over the past 10-200 Myr, with shorter timescales at the shortest wavelengths (see Table 1).
| Band | Age Range (Myr) a | Lx Units | logCx | * /
*(K98) |
References |
| FUV | 0-10-100 | ergs s-1 (ν Lν) | 43.35 | 0.63 | 1, 2 |
| NUV | 0-10-200 | ergs s-1 (ν Lν) | 43.17 | 0.64 | 1, 2 |
| Hα | 0-3-10 | ergs s-1 | 41.27 | 0.68 | 1, 2 |
| TIR | 0-5-100 b | ergs s-1 (3-1100 µm) | 43.41 | 0.86 | 1, 2 |
| 24 µm | 0-5-100 b | ergs s-1 (ν Lν) | 42.69 | 3 | |
| 70 µm | 0-5-100 b | ergs s-1 (ν Lν) | 43.23 | 4 | |
| 1.4 GHz | 0-100: | ergs s-1 Hz-1 | 28.20 | 1 | |
| 2-10 keV | 0-100: | ergs s-1 | 39.77 | 0.86 | 5 |
| a Second number gives mean age of stellar population contributing to emission, third number gives age below which 90% of emission is contributed. | |||||
| b Numbers are sensitive to star formation history, those given are for continuous star formation over 0-100 Myr. For more quiescent regions (e.g., disks of normal galaxies) the maximum age will be considerably longer. | |||||
| NOTE. - References: (1) Murphy et al. (2011); (2) Hao et al. (2011); (3) Rieke et al. (2009); (4) Calzetti et al. (2010a); (5) Ranalli et al. (2003) | |||||
For extragalactic studies, this subject has been revolutionised by the launch of the Galaxy Evolution Explorer (GALEX) mission (Martin et al. 2005a). It imaged approximately two thirds of the sky in far-ultraviolet (FUV; 155 nm) and near-ultraviolet (NUV; 230 nm) channels to limiting source fluxes mAB ~ 20.5, and obtained deeper full-orbit or multi-orbit imaging (mAB ≥ 23) for selected galaxies and fields such as those in the Sloan Digital Sky Survey (SDSS). The spatial resolution (4.5 to 6 FWHM) of the imager makes it an especially powerful instrument for integrated measurements of distant galaxies and resolved mapping of the nearest external galaxies. Although most scientific applications of GALEX data to date have arisen from its imaging surveys, a series of spectroscopic surveys and pointed observations of varying depths were carried out as well (Martin et al. 2005a).
The main impacts of GALEX for this subject are summarized in § 5. Broadly speaking its largest impacts were in providing integrated UV fluxes (and hence SFR estimates) for hundreds of thousands of galaxies, and in exploiting the dark sky from space at these wavelengths to reveal star formation at low surface brightnesses and intensities across a wide range of galactic environments.
Other spaceborne instruments have also provided important datasets in this wavelength region, including the XMM Optical Monitor (Mason et al. 2001) and the Swift UV/Optical Telescope (Roming et al. 2005). Although these instruments were primarily designed for follow-up of X-ray and gamma-ray observations, they also have been used to image nearby and distant galaxies, with the advantage of higher spatial resolution (~ 1′′ FWHM). Several important studies have also been published over the past decade from observations made with the Ultraviolet Imaging Telescope on the ASTRO missions (Stecher et al. 1997; Marcum et al. 2001). The Hubble Space Telescope continues to be a steady source of observations (mainly in the NUV) for targeted regions in nearby galaxies.
The primary disadvantage of the ultraviolet is its severe sensitivity to interstellar dust attenuation. The availability of new data from GALEX and other facilities has stimulated a fresh look at this problem. If the intrinsic color of the emitting stellar population is known a priori, the FUV-NUV color or the UV spectral slope (usually denoted β) can be used to estimate the dust attenuation, and numerous calibrations have been published (e.g., Calzetti et al. 1994; Kong et al. 2004; Seibert et al. 2005; Johnson et al. 2007; Salim et al. 2007; Treyer et al. 2007; Hao et al. 2011). The accuracy of these prescriptions rests heavily on the presumed (but uncertain) intrinsic colors, the shape of the dust extinction curve, and the complicated effects of geometry and scattering when averaging over a large physical region (e.g., Gordon et al. 2001).
The abundance of high quality far-infrared observations of nearby galaxies has made it possible to test how well the UV colors correlate with independent estimates of the dust attenuation from the IR/UV flux ratios. Earlier observations of bright starburst galaxies suggest a tight relation between the logarithmic IR/UV ratio (often termed the "IRX") and UV color (e.g., Meurer et al. 1999), and indeed this "IRX-β relation" provided the primary means for calibrating the color versus attenuation relation. Subsequent observations of a wider range of galaxies, however, has revealed a much larger scatter in the relation (e.g., Boquien et al. 2012). When galaxies of all types are considered, the scatter in actual FUV attenuations for a fixed FUV-NUV color can easily be two orders of magnitude. Even when the comparison is restricted to galaxies with intrinsically high SFRs (as might be observed at high redshift), the uncertainties can easily reach an order of magnitude. As a result, more weight is being applied to alternative estimates of attenuation corrections and SFRs based on combinations of UV with IR measurements (§ 3.7).
The remaining SFR indicators to be discussed here rely on measuring starlight that has been reprocessed by interstellar gas or dust, or on tracers related to the death of massive stars. The most widely applied of these are the optical and near-infrared emission lines from ionized gas surrounding massive young stars. For a conventional IMF, these lines trace stars with masses greater than ~ 15 M⊙, with the peak contribution from stars in the range 30-40 M⊙. As such, the lines (and likewise the free-free radio continuum) represent a nearly instantaneous measure of the SFR, tracing stars with lifetimes of ~ 3-10 Myr (Table 1).
The application of Hα and other emission line SFR tracers has expanded dramatically in the last decade, through very large spectroscopic surveys of samples of local and distant galaxies, narrow-band emission-line imaging surveys, and large imaging surveys of nearby galaxies designed to study spatial variations in the SFR. Advances in near-infrared instrumentation have also led to the first systematic surveys in the Paschen and Brackett series lines, as well as for Hα observed at high redshifts. Results from several of these surveys are discussed and referenced in § 5.
The Hα emission line remains the indicator of choice for observations of local and distant galaxies alike, but for moderate redshifts, the bluer visible lines have been applied, in particular the [O II] forbidden line doublet at 372.7 nm. This feature is subject to severe systematic uncertainties from dust attenuation and excitation variations in galaxies. K98 published a single SFR calibration for the line, but subsequent analyses (e.g., Jansen et al. 2001; Kewley et al. 2004; Moustakas et al. 2006) have shown that the systematic effects must be removed or at least calibrated to first order for reliable measurements. Even then, the uncertainties in the [O II]-based SFRs are much larger than for Hα.
Over the past decade, increasing attention has been given to measurements of the redshifted Lyα line (λrest = 121.6 nm) as a tracer of star-forming galaxies, especially at high redshifts where it provides unique sensitivity to both low-mass star-forming galaxies and intergalactic gas clouds or "blobs" (e.g., Ouchi et al. 2009; Ouchi et al. 2010). The strength of the line (8.7 times stronger than Hα for Case B recombination) makes it an attractive tracer in principle, but in realistic ISM environments the line is subject to strong quenching from the combination of resonant trapping and eventual absorption by dust, usually quantified in terms of a Lyα escape fraction. As a result Lyα surveys to date have been mainly used for identifying large samples of distant star-forming galaxies. Applying the line as a quantitative SFR tracer requires an accurate measurement of the escape fraction. Several ongoing studies are quantifying this parameter by comparing Lyα fluxes of galaxies with independent SFR tracers such as Hα or the UV continuum (e.g., Atek et al. 2009; Scarlata et al. 2009; Blanc et al. 2011; Hayes et al. 2011). These show that the escape fraction varies wildly between galaxies with a range of more than two orders of magnitude (order 0.01 to 1), but also increases systematically with redshift. It is possible that Lyα will prove to be a powerful SFR tracer for the highest-redshift objects, but in view of the large scatter and systematic uncertainties associated with its use we have chosen not to include a SFR calibration of the line in this review.
Other workers have investigated the efficacy of the infrared fine-structure cooling lines, which arise in HII regions or PDRs, as quantitative SFR tracers. Ho & Keto (2007) compiled data from ISO and Spitzer on the [Ne2]12.8 µm and [Ne3]15.6 µm lines, and found that the sum of the line fluxes correlates well with hydrogen recombination line fluxes, with a scatter of ~ 0.3 dex. In a similar vein, Boselli et al. (2002) and Rodriguez-Fernandez et al. (2006) have investigated the applicability of the [C2]158 µm line as a SFR measure. They found good general correspondance between the [C2] luminosity and other measures of the SFR such as ionized gas and dust emission, but the scatter in the relationships is at least a factor of ten. Even larger variations in L[CII] / LIR were found in a more diverse sample of star-forming galaxies by Malhotra et al. (1997). The availability of a rich new set of [C2] observations from Herschel, combined with the detection of redshifted [C2] emission in submillimeter galaxies (SMGs) from ground-based instruments, has sparked a resurgence of interest in this application.
The largest systematic errors affecting Hα-based SFRs are dust attenuation and sensitivity to the population of the upper IMF in regions with low absolute SFRs. For regions with modest attenuations the ratios of Balmer recombination lines (Balmer decrement) can be used to correct for dust, and this method has been applied in a number of large spectrophotometric surveys of nearby galaxies (e.g., Kewley et al. 2002; Brinchmann et al. 2004; Moustakas et al. 2006). The Balmer decrements offer only approximate corrections for attenuation because of variations on scales smaller than the resolution. These variations may lead to an underestimate of the extinction because lines of sight with low extinction are more heavily weighted within the beam. This problem can be addressed partly by adopting a reddening law which compensates in part for these departures from a pure foreground scheme geometry (e.g., Charlot & Fall 2000). The attenuation of the emission lines is found to be systematically higher than that of the continuum starlight at the same wavelengths (e.g., Calzetti et al. 1994), which presumably reflects the higher concentrations of dust in the young star-forming regions.
As is the case with UV-based SFRs, the availability of far-infrared maps and luminosities for nearby galaxies has also made it possible to calibrate multi-wavelength methods for applying dust attenuation corrections to these measurements (§ 3.7). They reveal that the Balmer decrement provides reasonably accurate attenuation corrections in normal galaxies, where attenuations are modest (typically 0-1 mag at Hα), and care is taken to correct the emission-line fluxes for underlying stellar absorption. The Balmer decrement method for estimating dust attenuation breaks down badly, however in circumnuclear starbursts or other dusty galaxies (e.g., Moustakas et al. 2006). With the advent of large-format integral-field spectrographs there is promise of applying Balmer decrement measurements on a spatially-resolved basis in galaxies (e.g., Blanc 2010; Sánchez et al. 2012).
The accuracy of SFRs derived from emission lines will also degrade in regions where the SFR is so low that one enters the regime of small number statistics in the population of massive ionizing stars. If the IMF itself were completely blind to the SFR, we would expect such effects to become apparent below Hα luminosities of order 1038 ergs s-1, or SFRs of order 0.001 M⊙ yr-1 (e.g., Cerviño et al. 2003). At the very least, this effect will produce a much larger scatter in ionizing flux per unit SFR in this regime. In low-SFR regions, this sampling noise can be exacerbated by the short lifetimes of the ionizing stars, producing large temporal fluctuations in Hα emission even for a fixed longer-term SFR. As a result, other tracers (e.g., FUV emission) tend to provide more accurate and sensitive measurements of the SFR at low star formation levels.
Can these effects cause systematic errors in the SFRs? Pflamm-Altenburg et al. (2007; 2009) have investigated the effect of an IGIMF (§ 2.5) on SFR tracers, and shown that the systematic depletion of massive stars in low-SFR environments could cause Hα to substantially underestimate the actual SFR. Interestingly a systematic deficit of Hα emission in dwarf galaxies with low SFRs and in low SFR density regions is observed (Sullivan et al. 2000; Bell & Kennicutt 2001; Lee et al. 2009a; Meurer et al. 2009). Recent work suggests however that the systematic dependence of the Hα/UV ratio may be produced instead by temporal variations in SFRs, without having to resort to modifying the IMF itself (Fumagalli et al. 2011; Weisz et al. 2012).
3.4. Infrared Emission: The Impact of Spitzer and Herschel
Interstellar dust absorbs approximately half the starlight in the universe and re-emits it in the infrared, so measurements in the IR are essential for deriving a complete inventory of star formation. This section focusses on the transformational results which have come from the Spitzer Space Telescope (Werner et al. 2004) and the Herschel Space Observatory (Pilbratt et al. 2010). A review in this journal of extragalactic science from Spitzer can be found in Soifer et al. (2008).
Three other space missions are beginning to influence this subject: the AKARI mission (Murakami et al. 2007), the Wide-field Infrared Survey Explorer (WISE) mission (Wright et al. 2010), and the Planck mission (Planck Collaboration et al. 2011a). These observatories conducted all-sky surveys, with AKARI imaging in the 2.4 - 160 µm region, WISE in the range of 3.4 - 22 µm, and Planck at 350 - 850 µm (with several bands extending to longer wavelengths). Much of the science from these missions is just beginning to emerge, but they will provide very important results in this subject in the coming decade.
While early applications of dust-based SFR measurements effectively (and necessarily) assumed a one-component dust model, subsequent observations show that the dust emission is comprised of distinct components, each with different spatial distributions and couplings to the young stars. At wavelengths of ~ 5-20 µm, the emission is dominated by molecular bands arising from polycyclic aromatic hydrocarbons (PAHs). Longward of λ ~ 20 µm, the emission is dominated by thermal continuum emission from the main dust grain population. Emission from small grains transiently heated by intense radiation fields (usually in or near star-forming regions) is important out to about 60 µm, whereas at longer wavelengths, emission from larger grains with steady state temperatures dominates (Draine 2003).
The distribution of these different emission components is illustrated in Figure 2, which shows Spitzer and Herschel images of the nearby star-forming galaxy, NGC 6946, at wavelengths ranging from 3.6-500 µm. At 24 µm, the emission peaks around the youngest star-forming regions and HII regions, with a more diffuse component extending between these regions. As one progresses to longer wavelengths, the prominence of the diffuse component increases. Recent measurements with Herschel show that this is mainly a physical change, and not an artifact of lower spatial resolution at longer wavelengths (Boquien et al. 2011). This diffuse emission is analogous to the "infrared cirrus" emission observed in our own Galaxy. Interestingly PAH emission appears to correlate the most strongly with the longer-wavelength component of the thermal dust emission (e.g., Bendo et al. 2008), though it often also appears as resolved shells around the young star-forming regions (Helou et al. 2004).
 |
Figure 2. A montage of infrared images of NGC 6946 from Spitzer (SINGS) and Herschel (KINGFISH). Top panels: Spitzer IRAC images at 3.6 µm and 8.0 µm, and MIPS image at 24 µm. The emission at these wavelengths is dominated by stars, small PAH dust grains, and small dust grains heated by intense radiation fields, respectively. Middle panels: Herschel PACS images at 70 µm, 100 µm, and 160 µ, processed with the Scanamorphos map making package. Note the excellent spatial resolution despite the longer wavelengths, and the progressive increase in contributions from diffuse dust emission ("cirrus") with increasing wavelength. Bottom panels: Herschel SPIRE images at 250 µm, 350 µm, and 500 µm. These bands trace increasingly cooler components of the main thermal dust emission, with possible additional contributions from "submillimeter excess" emission at the longest SPIRE wavelengths. FWHM beam sizes for the respective Herschel bands are shown in the lower left corner of each panel. This figure originally appeared in the Publications of the Astronomical Society of the Pacific (Kennicutt et al. 2011). Copyright 2011, Astronomical Society of the Pacific; reproduced with permission of the Editors. |
These variations in the morphologies in the different dust emission components translate into considerable variations in the dust SEDs within and between galaxies (e.g., Dale & Helou 2002; Dale et al. 2005; Smith et al. 2007), and as a consequence the conversion of infrared luminosities into SFRs must change for different IR wavelengths. Most early applications of the dust emission as a SFR tracer were based on the integrated total-infrared (TIR) emission. This parameter has the physical advantage of effectively representing the bolometric luminosity of a completely dust-enshrouded stellar population. The TIR-based SFR calibration derived in K98, applicable in the limits of complete dust obscuration and dust heating fully dominated by young stars, is still in widespread use today. For most galaxies however this complete wavelength coverage will not be available, so many workers have calibrated monochromatic SFR indices, usually tuned to one of the Spitzer or Herschel bands, including 24 µm (e.g., Wu et al. 2005a; Alonso-Herrero et al. 2006; Calzetti et al. 2007; Relaño et al. 2007; Rieke et al. 2009, and references therein), and 70 and 160 µm (Calzetti et al. 2010a). The latter paper contains an excellent discussion comparing the various calibrations in the literature at the time.
As with all of the SFR indicators, the dust emission is subject to important systematic effects. Just as the UV and visible tracers miss radiation that has been attenuated by dust, the infrared emission misses the starlight that is not absorbed by dust (e.g., Hirashita et al. 2001). As discussed earlier, dust attenuates only about half of the integrated starlight of galaxies on average, so the infrared emission will systematically underestimate the SFR if the missing fraction of star formation is not incorporated into the calibrations. This "missing" unattenuated component varies from essentially zero in dusty starburst galaxies to nearly 100% in dust-poor dwarf galaxies and metal-poor regions of more massive galaxies. Another major systematic error works in the opposite direction; in most galaxies, evolved stars (e.g., ages above ~ 100-200 Myr) contribute significantly to the dust heating, which tends to cause the IR luminosity to overestimate the SFR. The fraction of dust heating from young stars varies by a large factor among galaxies; in extreme circumnuclear starburst galaxies or individual star-forming regions, nearly all of the dust heating arises from young stars, whereas in evolved galaxies with low specific SFRs, the fraction can be as low as ~ 10% (e.g., Sauvage & Thuan 1992; Walterbos & Greenawalt 1996; Cortese et al. 2008). In practical terms this means that the conversion factor from dust luminosity to SFR — even in the limit of complete dust obscuration — is not fixed, but rather changes as a function of the stellar population mix in galaxies. The difference in conversion factor between starbursts and quiescient galaxies with constant SFR, for example, is about a factor of 1.3-2 (e.g., Sauvage & Thuan 1992; Kennicutt et al. 2009; Hao et al. 2011).
The calibration of the mid-IR PAH emission as a quantitative SFR tracer deserves special mention. This index is of particular interest for studies of galaxies at high redshift, because the observed-frame 24 µm fluxes of galaxies at z = 1-3 tend to be dominated by redshifted PAH emission. A number of studies have shown that the PAH luminosity scales relatively well with the SFR in metal-rich luminous star-forming galaxies (e.g., Roussel et al. 2001; Peeters et al. 2004; Förster Schreiber et al. 2004; Wu et al. 2005a; Farrah et al. 2007; Calzetti et al. 2007), but the PAH bands weaken dramatically below metal abundances of approximately 1/4 to 1/3 Z⊙ (e.g., Madden 2000; Engelbracht et al. 2005; Calzetti et al. 2007; Smith et al. 2007), rendering them problematic as quantitative SFR tracers in this regime.
The best way to overcome these systematic biases is to combine the IR measurements with UV or visible-wavelength SFR tracers, to measure the unattenuated starlight directly and to constrain the dust-heating stellar population (§ 3.7). However, in cases where only IR observations are available one can attempt to incorporate corrections for these effects into the SFR calibrations themselves, and this approach has been taken by most authors (e.g., Calzetti et al. 2010b and references therein). Fortunately, for most galaxies with moderate to high specific SFRs, the effects of partial dust attenuation and cirrus dust heating by evolved stars appear to roughly compensate for each other. For example, Kewley et al. (2002) showed that for a sample of spiral galaxies with integrated emission-line spectra, the TIR-based calibration of K98 for dusty starburst galaxies was in good agreement with SFRs based on attenuation-corrected Hα line fluxes. However, one must avoid applying these IR-based recipes in environments where they are bound to fail, for example, in low-metallicity and other largely dust-free galaxies or in galaxies with low specific SFRs and a strong radiation field from more evolved stars.
The centimeter-wavelength radio continuum emission of galaxies consists of a relatively flat-spectrum, free-free component, which scales with the ionizing luminosity (subject to a weak electron temperature dependence) and a steeper spectrum synchrotron component, which overwhelmingly dominates the integrated radio emission at ν ≤ 5 GHz. The free-free component can be separated with multi-frequency radio measurements or high-frequency data (e.g., Israel & van der Hulst 1983; Niklas et al. 1997; Murphy et al. 2011), to provide a photoionization-based measure of the SFR, without the complications of dust attenuation which are encountered with the Balmer lines.
At lower frequencies the integrated emission is dominated by the synchrotron emission from charged particles produced by supernovae. A SFR calibration has not been derived from first principles, but observations have repeatedly confirmed a tight correlation between this non-thermal emission and the far-infrared emission of galaxies, which favors its application as a SFR tracer (e.g., Helou et al. 1985; Condon 1992). Moreover, improvements to receiver technology with the Expanded Very Large Array (EVLA) and other instruments have made the radio continuum a primary means of identifying star-forming galaxies at high redshift and estimating their SFRs. As a result it is appropriate to include it in this discussion of SFR tracers.
Current calibrations of the radio continuum versus SFR relation are bootstrapped from the far-infrared calibrations, using the tight radio-IR correlation. The steep synchrotron spectrum makes this calibration strongly wavelength dependent, and most are referenced to 1.4 GHz (e.g., Yun et al. 2001; Condon 1992; Bell 2003). The calibration adopted here in § 3.8 is derived in similar fashion, but adapted to the Kroupa IMFs.
As described above, the IR-based SFR calibrations break down severely in faint galaxies with low dust contents, yet the radio-IR correlation remains tight and nearly linear over the entire luminosity range. How can this arise? The likely explanation can be found in Bell (2003) and references therein, where it is shown that the decrease in dust opacity in low-mass galaxies is accompanied by a decline in synchrotron emission relative to other tracers of the SFR. This is seen most directly as a decline in the ratio of non-thermal radio emission (still dominant in the 1-5 GHz region) to the free-free thermal radio emission. Since the thermal radio emission is directly coupled to the stellar ionization rate and SFR, the relative decline in synchrotron luminosity must reflect a physical decline per unit SFR. If correct then the continuity of the radio-IR relation to low luminosities is the result of a "cosmic conspiracy" (Bell 2003), and one should beware of applying the method in galaxies fainter than ~ 0.1 L*.
Over the past decade, the integrated hard X-ray emission of galaxies has been increasingly applied as a SFR tracer. The component of X-ray emission that does not arise from AGN accretion disks is dominated by massive X-ray binaries, supernovae and supernova remnants, and massive stars, all associated with young stellar populations and recent star formation. Furthermore the observed 2-10 keV fluxes of galaxies are observed to be strongly correlated with their infrared and non-thermal radio continuum fluxes (e.g., Bauer et al. 2002; Ranalli et al. 2003; Symeonidis et al. 2011), strengthening the link to the SFR.
Since there is no way to calibrate the relation between X-ray luminosity and SFR from first principles, the calibration is usually bootstrapped from the infrared or radio. Ranalli et al. (2003) derived such a calibration for integrated 2-10 keV X-ray luminosities, referenced to the K98 calibrations and IMF, and this relation is still widely applied today. Persic et al. (2004) derived an alternate calibration in terms of the hard X-ray binary luminosity alone, which is useful for nearby resolved galaxies. Calibrations of the SFR in terms of X-ray luminosity and stellar mass have been published by Colbert et al. (2004) and Lehmer et al. (2010). For simplicity, we have listed in Table 1 the widely-applied relation of Ranalli et al. (2003), but adjusted to the Kroupa IMF used for the other calibrations.
3.7. Composite Multi-Wavelength Tracers
Large multi-wavelength surveys of galaxies allow tests and calibrations of SFR indices that combine information from more than one tracer and exploit the complementary strengths of different wavelengths. Currently this capability is mainly limited to nearby galaxies, but with the expansion of far-infrared to millimeter surveys of high-redshift galaxies, opportunities to apply multi-wavelength diagnostics to distant galaxies should expand in the coming decade (e.g., Overzier et al. 2011; Reddy et al. 2012).
The most widely explored of these methods have combined UV (usually FUV) observations with infrared measurements to construct dust-corrected SFRs, using an approximate energy-balancing approach. In its simplest form one can use a linear combination of UV and IR luminosities to correct the UV fluxes for dust attenuation:
 |
(10) |
where the luminosities are usually calculated from flux densities using the definition L = ν Lν, and the coefficient η is dependent on the bandpasses chosen for the UV and IR measurements. The most common form of this correction uses GALEX FUV (155 nm) and total-infrared luminosities, hence:
 |
(11) |
Other prescriptions sometimes adopt a higher order polynomial dependence on LIR (e.g., Buat et al. 2005), but for brevity we only discuss the linear combinations here. In most cases, η < 1, because only part of the dust-heating radiation is contained in the FUV band, and in many galaxies there is significant dust heating and TIR emission arising from stars other than the UV-emitting population (IR cirrus). The coefficient η can be calibrated theoretically using evolutionary synthesis models, or empirically, using independent measurements of dust-corrected SFRs (e.g., Treyer et al. 2010; Hao et al. 2011).
Early applications of this method were largely restricted to luminous starburst galaxies and star-forming regions, for which UV and IR data could be obtained prior to the advent of GALEX, Spitzer, and Herschel (e.g., Buat et al. 1999; Meurer et al. 1999; Gordon et al. 2000), yielding values of η ~ 0.6. Subsequent analyses extending to normal star-forming galaxies (e.g., Hirashita et al. 2003; Kong et al. 2004; Burgarella et al. 2005; Buat et al. 2005; Treyer et al. 2010; Hao et al. 2011) typically produce values of η which are somewhat lower (e.g., 0.46 for Hao et al. 2011), whi ch almost certainly reflects the larger contribution to dust heating from starlight longward of the FUV. Considering the wide differences in dust heating populations between starburst and normal galaxies, however, this difference of ~ 30% is hardly crippling, especially when it reduces dramatically the much larger systematic errors from UV or IR-based SFRs alone.
A similar energy-balancing approach has been applied to derive dust-corrected emission-line luminosities of galaxies (Calzetti et al. 2007; Zhu et al. 2008; Kennicutt et al. 2009; Treyer et al. 2010). Here the equivalent parameter to η above is calibrated using independent estimates of the Hα attenuation, usually the recombination line decrement as measured from the Paα / Hα or Hα / Hβ ratio. Kennicutt et al. (2009) have shown that this approach can be more broadly applied to estimate attenuation corrections for other emission lines (e.g., [O II]), and it can be calibrated using TIR fluxes, single-band IR fluxes, or even 1.4 GHz radio continuum fluxes. An illustration of the effectiveness of the method is shown in Figure 3, taken from Kennicutt et al. (2009). The top panel shows the consistency between an IR-based tracer (24 µm luminosity) used alone and the dust-corrected Hα luminosity (via the integrated Balmer decrement). There is a general correlation but considerable scatter and a pronounced non-linearity, which reflects a general correlation of average dust attenuation with the SFR itself. The lower panel plots the best fitting linear combination of Hα and IR (in this case 24 µm) luminosities against the Balmer-decrement-corrected Hα luminosities. The scatter between the tracers now is reduced severalfold, and the non-linearity in the comparison with IR luminosities alone is essentially removed.
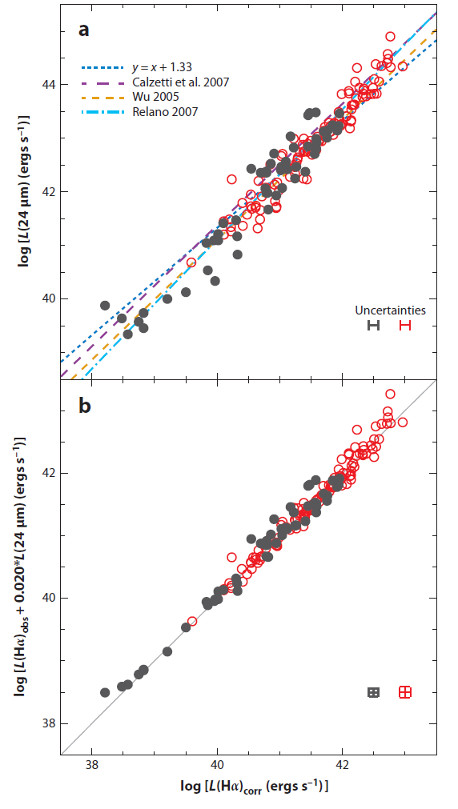 |
Figure 3. Top: relation between observed 24 µm IR luminosity and dust-corrected Hα luminosity for nearby galaxies. The dust corrections were derived from the absorption-corrected Hα / Hβ ratios in optical spectra. The dotted line shows a linear relation for comparison, while the other lines show published fits to other samples of galaxies. Bottom: linear combination of (uncorrected) Hα and 24 µm luminosities compared to the same Balmer-corrected Hα luminosities. Note the tightness and linearity of the relation over nearly the entire luminosity range. Taken from Kennicutt et al. (2009); reproduced by permission of the AAS. |
These composite SFR indicators are not without systematic uncertainties of their own. Questions remain about the systematic reliability of the independent attenuation calibrations (in particular with the effects of dust geometry on the Balmer decrements), and most of the recipes still retain a dependence on stellar population age, via the infrared term; for example the best fitting values of η for HII regions and young starbursts differ from those of normal star forming galaxies by a factor of ~ 1.5, consistent with expectations from evolutionary synthesis models, as discussed in § 3.8 (Kennicutt et al. 2009). Nevertheless they represent a major improvement over single-wavelength tracers, and provide a valuable testing ground for calibrating and exploring the uncertainties in the monochromatic indicators (e.g., Calzetti et al. 2010b).
Table 2 lists examples of dust attenuation corrections using combinations of FUV and Hα fluxes with various infrared and radio tracers, taken from Hao et al. (2011) and Kennicutt et al. (2009), respectively. These can be applied in combination with the monochromatic SFR zeropoint calibrations listed in Table 1 (§ 3.8) to derive dust-corrected SFR measurements.
| Composite Tracer | Reference |
| L(FUV)corr = L(FUV)obs + 0.46 L(TIR) | 1 |
| L(FUV)corr = L(FUV)obs + 3.89 L(25) | 1 |
| L(FUV)corr = L(FUV)obs + 7.2 × 10¹⁴ L(1.4 GHz) a | 1 |
| L(NUV)corr = L(NUV)obs + 0.27 L(TIR) | 1 |
| L(NUV)corr = L(NUV)obs + 2.26 L(25) | 1 |
| L(NUV)corr = L(NUV)obs + 4.2 × 10¹⁴ L(1.4 GHz) a | 1 |
| L(Hα)corr = L(Hα)obs + 0.0024 L(TIR) | 2 |
| L(Hα)corr = L(Hα)obs + 0.020 L(25) | 2 |
| L(Hα)corr = L(Hα)obs + 0.011 L(8) | 2 |
| L(Hα)corr = L(Hα)obs + 0.39 × 10¹³ L(1.4 GHz) a | 2 |
| a Radio luminosity in units of ergs s-1 Hz-1 | |
| References: (1) Hao et al. (2011); (2) Kennicutt et al. (2009) | |
3.8. An Updated Compendium of Integrated SFR Calibrations
K98 presented calibrations for SFRs derived from UV continuum, TIR, Hα emission-line, and [O II] emission-line luminosities, which have come into common usage in the field. The considerable expansion of the subject to other wavelengths and SFR diagnostics since that time motivates a revisit of these calibrations.
Nearly all of these calibrations are based on evolutionary synthesis models, in which the emergent SEDs are derived for synthetic stellar populations with a prescribed age mix, chemical composition, and IMF. The K98 calibrations employed a mix of models from the literature, and assumed a single power-law IMF (Salpeter 1955), with mass limits of 0.1 and 100 M⊙. This IMF gave satisfactory SFR calibrations relative to that of more realistic IMFs for Hα, but for other wavelengths, the relative calibrations using different tracers are sensitive to the precise form of the IMF. Today most workers calibrate SFR tracers using a modern IMF with a turnover below ~ 1 M⊙, for example the IMF of Kroupa & Weidner (2003), with a Salpeter slope (α* = -2.35) from 1-100 M⊙ and α* = -1.3 for 0.1-1 M⊙. The calibrations presented here use this IMF, but the IMF fit from Chabrier (2003) yields nearly identical results (e.g., Chomiuk & Povich 2011). The past decade has also seen major improvements in the stellar evolution and atmospheric models which are used to generate the synthetic SEDs. The results cited here use the Starburst99 models of Leitherer et al. (1999), which are regularly updated in the on-line version of the package.
Table 1 presents in compact form calibrations for a suite of SFR tracers in the form:
 |
(12) |
The table lists for each tracer the units of luminosity (Lx), the logarithmic SFR calibration constant Cx, and the primary reference(s) for the calibration. For methods presented in K98, we also list the scaling constant between the new (Kroupa IMF, SB99 model) SFRs and those from K98. As in K98, the recipes for infrared dust emission are in the limit of complete dust attenuation and continuous star formation over a period of 0-100 Myr, which is appropriate for a typical dust-obscured starburst galaxy. Virtually all of the SFR calibrations presented in Table 1 are taken from the literature, and we strongly encourage users of these calibrations to cite the primary sources, whether or not they choose to cite this paper as well.
The second column of Table 1 lists the approximate age sensitivity of the different star formation tracers. These were estimated using the Starburst99 models in the approximation of constant star formation. The second number lists the mean stellar age producing the relevant emission, while the third column lists the age below which 90% of the relevant emission is produced. For the dust emission in the infrared these ages can only be estimated, because they depend on the detailed star formation history over periods of up to 100 Myr and longer, and they are also convolved with the level of dust attenuation as a function of stellar age. The numbers are given for the assumed starburst timescales above; for normal galaxies the 90th percentile age can be 500 Myr or longer.
All of the results were calculated for solar metal abundances, and readers should beware that all of the calibrations are sensitive to metallicity. These have been estimated by several authors using evolutionary synthesis models (e.g., Smith et al. 2002; Raiter et al. 2010), but the precise dependences are sensitive to the details of the input stellar models, in particular how effects of stellar rotation are modelled. The models cited above (which do not adopt a dependence of rotation on metallicity) show that a decrease in metal abundance by a factor of ten increases the FUV luminosity of a fixed mass and IMF population by ~ 0.07 ± 0.03 dex (for the IMFs assumed here), while the ionizing luminosity is more sensitive, increasing by ~ 0.4 ± 0.1 dex for a tenfold decrease in Z / Z⊙. The change in infrared luminosities for completely obscured regions should roughly track that for the FUV luminosity, but in most low-metallicity environments, the dust opacity will be severely reduced, producing a sharp fall in infrared emission for a given SFR.
3.9. The Challenge of Spatially-Resolved Star Formation Rates in Galaxies
Nearly all of the diagnostic methods described up to now have been designed for measuring integrated SFRs of galaxies or for regions such as starbursts, containing thousands (or more) of massive stars. The resulting SFR prescriptions implicitly assume that local variations in stellar age mix, IMF population, and gas/dust geometry largely average out when the integrated emission of a galaxy is measured.
With the advent of high-resolution maps of galaxies in the UV, IR, emission lines, and radio (and integral-field spectroscopic maps in the visible and near-infrared), one would like of course to extend these diagnostic methods to create fully-sampled spatially-resolved "SFR maps" of galaxies. This extrapolation to much smaller regions within galaxies (or to galaxies with extremely low SFRs), however, is not at all straightforward. At smaller linear scales, nearly all of the statistical approximations cited above begin to break down.
First, when the SFR in the region studied drops below ~ 0.001-0.01 M⊙ yr-1 (depending on the SFR tracer used), incomplete sampling of the stellar IMF will lead to large fluctuations in the tracer luminosity for a fixed SFR. These begin to become problematic for luminosities of order 1038 - 1039 ergs s-1 for emission-line, UV, or IR tracers, and they are especially severe for the ionized gas tracers, which are most sensitive to the uppermost parts of the stellar IMF. For actively star forming normal disk galaxies, this onset of stochasticity typically occurs on spatial scales of order 0.1-1 kpc, but the region can be considerably larger in galaxies, or parts of galaxies, with lower SFRs. Note that this breakdown on local scales occurs regardless of whether the IMF itself varies systematically.
As a prime example of this stochasticity, consider what astronomers in M51 would observe if they examined the solar neighborhood in the Milky Way from a distance of 10 Mpc. In a pixel of 100 pc radius centered on the Sun they would observe no molecular gas and no star formation. If they degraded their resolution to a radius of 300 pc, they would pick up all the Gould Belt clouds, but no localized Hα emission. Within a slightly larger radius of 500 pc, their beam would include Orion, with its O stars and HII region. (For this example, we consider only the stars and emission from the Orion Nebula Cluster (ONC) stars and emission, for which we have good numbers, not the full Orion clouds and OB associations.) This roughly doubles the number of YSOs. Our M51 observers would measure Σmol = 0.11 M⊙ pc-2, but if they applied the relation between SFR and Hα luminosity from K98, they would derive Σ(SFR) a factor of 10 lower than the actual SFR in Orion, based on the actual stellar content of the ONC and a relatively long timescale of 3 Myr (Chomiuk & Povich 2011), and they would miss the total SFR within 500 pc by a factor of 20 because the other clouds produce no O stars. This severe underestimate for Orion itself from Hα emission results because the Orion cluster is too small to fully populate the IMF; its earliest spectral type is O7 V, and so the star cluster produces relatively little ionizing luminosity relative to its total mass and SFR. If the distant observers used the total infrared emission of Orion instead, they would still underestimate its SFR by a factor of 8 (Lada et al. 2012) (a factor of 10 with the newer conversions in Table 1).
Secondly, when the spatial resolution of the SFR measurements encompass single young clusters, such as Orion, the assumption of continuous star formation which is embedded in the global SFR recipes breaks down severely. In such regions that emission at all wavelengths will be dominated by a very young population with ages of typically a few Myr, which will be shorter than the averaging times assumed for all but the emission-line tracers. These changes affect both the relative luminosities of star formation tracers in different bands and of course the interpretation of the "star formation rate" itself. Technically speaking the luminosities of young star-forming clusters only provide information on the masses of the regions studied, and converting these to SFRs requires independent information on the ages and/or age spreads of the stars in the region.
A third measuring bias will set in if the resolution of the measurements becomes smaller than the Strömgren diameters of H II regions or the corresponding dust emission nebulae, which tend to match or exceed those of the H II regions (e.g., Watson et al. 2008; Prescott et al. 2007). This scale varies from < 100 pc in the Milky Way to 200-500 pc in actively star-forming galaxies such as NGC 6946 (Figure 2). On these small scales indirect tracers of the SFR (e.g., Hα, IR) tend to trace the surfaces and bubbles of clouds rather than the young stars. By the same token, much of the Hα and dust emission in galaxies, typically 30-60%, is emitted by diffuse ionized gas and dust located hundreds of parsecs or more from any young stars (e.g., Oey et al. 2007; Dale et al. 2007). Such emission produces a false positive signal of star formation, and care is needed to account for its effects when mapping the SFR within galaxies.
Taken together, these factors complicate, but do not prevent, the construction of 2D maps of SFRs, so long as the methodology is adapted to the astrophysical application. For example, radial profiles of SFR distributions in galaxies may still be reliably derived using the integrated SFR calibrations, providing that large enough annuli are used to assure that the IMF is fully populated in aggregate, and the SFR is regarded to be averaged over time scales of order 100 Myr. Likewise a 2D distribution of star formation over the last 5 Myr or so can be derived from a short-lived tracer such as Hα emission, if the spatial coverage is limited to very young regions, and structure on scales smaller than individual HII regions is ignored. Maps of integrated Hα and IR emission can be used to study the population of star-forming regions and the star formation law, when restricted to young regions where the physical association of gas and stars is secure (§ 6.4). An alternative approach is to apply direct stellar photospheric tracers, such as the ultraviolet continuum emission on large scales (bearing in mind the variable 10-300 Myr time scales traced by the UV), or resolved stellar tracers such as YSOs or deep visible-wavelength color-magnitude diagrams, to map the distributions of young stars directly (§ 3.1). Likewise it should be possible to use pixel-resolved SEDs of galaxies in the UV-visible to derive dust-corrected UV maps, and possibly apply local corrections for age in the maps. With such a multiplicity of approaches, we anticipate major progress in this area, which will be invaluable for understanding in detail the patterns of star formation in galaxies and connecting to detailed studies within the MW.