


Owing to its vicinity, the Galactic bulge has always been targeted as the ideal benchmark for structure, kinematic, and stellar populations studies of bulges. In fact, it can be studied at a unique level of detail, in comparison to external galaxies, thanks to the possibility of measuring the properties of individual stars. However, our inside view of the Galaxy generally restricts our knowledge to pencil beam areas around the Galactic centre due to either the high extinction, the crowding, or the superposition of multiple structures along the LOS, making studies of the inner Galactic regions challenging. The structure of the Galaxy has accounted for a significant amount of literature in the past and the topic has come back in the limelight in recent years. In this section I briefly review the Galactic bulge topic focusing on its intrinsic shape heading the readers to other chapters in this volume for more information about its stellar content and kinematics.
In recent decades it has become clear that the Galaxy is a barred system (Blitz & Spergel, 1991, López-Corredoira, Cabrera-Lavers & Gerhard, 2005) and that most likely its central regions are dominated by a boxy bulge created by vertical instabilities within the Galactic bar (Dwek et al., 1995, Martinez-Valpuesta & Gerhard, 2011, Ness et al., 2013). The historical evolution of our knowledge of the intrinsic structure of the Galactic bulge has been written by a succession of progressively larger scale, deeper sensitivity photometric and spectroscopic surveys.
The first attempt to understand the shape of the Galactic bulge was made by de Vaucouleurs & Pence (1978). They found that models ranging from spherical to F = 0.6 were able to represent well both the distribution of globular clusters around the Galactic centre and the infrared isophotes observed at 2.4µm (Maihara et al., 1978). The flattening of the Galactic bulge was then further constrained with the arrival of the Infrared Astronomical Satellite (IRAS). Using IRAS data, Harmon & Gilmore (1988) and Whitelock, Feast & Catchpole (1991) found values of the intrinsic flattening spanning 0.6 < F < 0.8 using JHK near-infrared bands. Similarly, Kent, Dame & Fazio (1991) found that, at first order, the Galactic bulge can be represented by an oblate ellipsoid with F = 0.61 using data from the Infrared Telescope (IRT).
The picture changed drastically with the advent of the COBE satellite (Hauser et al., 1990). The new striking image of the Milky Way (Figure 5) provided by the DIRBE experiment on board of COBE allowed Blitz & Spergel (1991), and later on Blitz (1993), to find the first direct evidence for a bar at the Galactic centre. Interestingly, they also found the presence of a triaxial bulge structurally distinct from the main bar. The modelling of this triaxial bulge was performed by different teams with different sets of data in the subsequent years. Consequently, different axis ratios represented as 1:Q:F were found: 1:0.33:0.22 (Dwek et al., 1995), 1:0.6:0.4 (Binney, Gerhard & Spergel, 1997), 1:0.43:0.29 (Stanek et al., 1997), 1:0.38:0.26 (Freudenreich, 1998), 1:0.54:0.33 (López-Corredoira et al., 2000), 1:(0.3–0.4):0.3 (Bissantz & Gerhard, 2002), 1:0.5:0.4 (López-Corredoira, Cabrera-Lavers & Gerhard, 2005). In general, these values implied the Galactic bulge to be a triaxial structure with a tendency to prolateness, thus not in agreement with the triaxial/oblate picture outlined in Section 4 for extragalactic bulges.
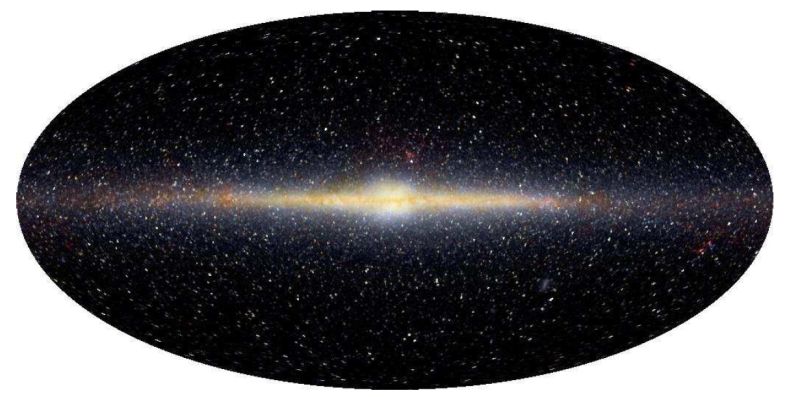 |
Figure 5. False-colour image of the near-infrared sky as seen by the DIRBE. Data at 1.25, 2.2, and 3.5 µm wavelengths are represented respectively as blue, green and red colours. The image is presented in Galactic coordinates, with the plane of the Milky Way Galaxy horizontal across the middle and the Galactic centre at the centre. Credits: E. L. Wright (UCLA), The COBE Project, DIRBE, NASA. |
Although the idea of a triaxial bulge worked well at first order, the boxy shape noticed earlier by Kent, Dame & Fazio (1991) and Kent (1992) and confirmed by Dwek et al. (1995) was not recovered by a triaxial ellipsoid. In the meanwhile, different scenarios came up to explain these differences and account for the continuously increasing kinematic and stellar populations information. Alard (2001) suggested the presence of two different bars in the Galaxy by analysing data from the Two Micron All Sky Survey (2MASS) (Skrutskie et al., 2006). Another possible scenario was worked out by Babusiaux et al. (2010) suggesting a model composed by a classical bulge in the centre and a boxy bulge in the outer parts.
Shen et al. (2010) proposed a simple model yet backed up by the high quality stellar kinematics provided by the Bulge Radial Velocity Assay (BRAVA) (Rich et al., 2007). Using N-body simulations they found no evidence for a classical bulge in the Galaxy but the bulge appears to be only part of the bar and therefore not a separated component. Figure 6 shows that the inclusion of a classical bulge greatly worsens the model fit to the data. Models from Shen et al. (2010) rule out that the Milky Way has a significant classical bulge with mass > 15% of the disc mass.
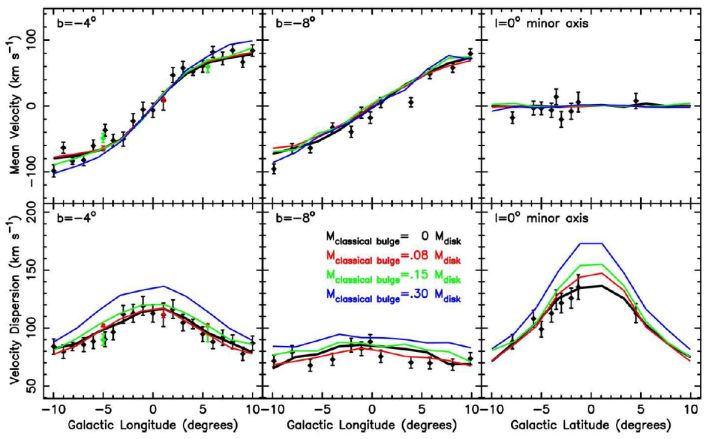 |
Figure 6. Best models fits to the BRAVA stellar kinematics using different hypothesis on the classical bulge mass. Mean velocity (top panels) and velocity dispersion (lower panels) profiles of all available kinematic observations presented in Shen et al. (2010). The left two panels are for the Galactic latitude b = 4° strip; the middle two panels are for the b = 8°; and the right two panels are for the l = 0° minor axis. The heavy black lines represent the model without a classical bulge. The red, green, and blue lines are for models whose classical bulges have masses of 8%, 15%, and 30%, respectively, of the disk mass. Including a classical bulge significantly worsens the model fits to the data, especially along the minor axis. Extracted from Shen et al. (2010). Reproduced with permission, ⓒ AAS. |
Following this line, Martinez-Valpuesta & Gerhard (2011) demonstrated how the star counts measurements by Cabrera-Lavers et al. (2007) agrees with a scenario composed by a single bar and a boxy bulge. More recent measurements of star counts from the VISTA Variables in The Via Lactea (VVV) (Gonzalez et al., 2011), metallicity gradients from the Abundances and Radial velocity Galactic Origins Survey (ARGOS) (Ness et al., 2013), or stellar kinematics from BRAVA have also been reconciled within this picture (Gerhard & Martinez-Valpuesta, 2012, Martinez-Valpuesta & Gerhard, 2013).