


The majority of stellar population studies in bulges are based on the comparison of the observed colors or spectral properties with the predictions of SSP models. While the SSP assumption may not be a bad approximation for massive elliptical galaxies, it is most likely not a good one for spirals, which are believed to have a more extended star formation history (Kennicutt 1993, James et al. 2008).
In cases were the star formation history has been more complicated than just a single burst, the interpretation of the results based on analyses of single-stellar population is difficult. Bulges with an intermediate SSP-equivalent age could have formed all their stars at intermediate epochs or almost all at very early times and a small fraction at recent epochs.
To avoid these difficulties, some authors have tried to analyse their data assuming more realistic star formation histories. There are several examples in the literature where the stellar population properties have been derived using a parametric approach (Ganda et al. 2007, MacArthur et al. 2004, Kauffmann & et al. 2003) where a predefined shape for the star formation history and chemical enrichment is assumed. In this case, some parameters are fixed while others are fitted by comparing the observations with the predictions of the models. Ganda et al. (2007) compared three line-strength indices with the predictions based on two burst, and on exponentially declining star formation histories. They obtained, respectively, the age, metallicity and mass fraction of the youngest burst, and the e-folding (τ) time in the case of the exponentially declining star formation history. In the first case, they concluded that degeneracies in the parameter space prevented them from extracting useful conclusions. In the second case, they found that bulges with a larger central σ showed shorter e-folding times, more consistent with an instantaneous burst scenario. Low-σ galaxies have larger τ, indicating a more extended star formation history (see Fig. 6).
 |
Figure 6. Central aperture values for the e-folding time-scale τ against central velocity dispersion σ (both in units of decimal logarithm), in an exponentially declining star formation scenario; the τ values are obtained selecting amongst models with age = 10 Gyr.Figure from Ganda et al. (2007). |
The problem with this approach is that the results depend strongly on the priors – i.e., the wrong answer can be obtained with the wrong assumptions about the star formation history. Furthermore, the use of only a few line-strength indices makes it difficult to break the existing degeneracies in the parameter space, such as the age of the burst versus its strength, or the τ-metallicity degeneracy.
The availability of high-quality stellar libraries and associated stellar population models (e.g. Sánchez-Blázquez et al. 2006b, Vazdekis et al. 2010, Bruzual & Charlot 2003, Conroy & van Dokkum 2012) that predict, not only individual absorption line features but the whole spectral energy distribution, has allowed the development of new techniques that, fitting the whole spectrum, are able to obtain, not only SSP-equivalent ages and metallicities, but a more, in principle realistic, star formation history. Furthermore, by considering the information provided by the entire spectrum, the age and the metallicity are more easily separated (Sánchez-Blázquez et al. 2011). These techniques are non-parametric – i.e., no predefined shape for the star formation history is assumed. Codes that have been used to study the stellar population properties of galaxies include MOPED (Heavens et al. 2000); VESPA (Tojeiro et al. 2007); STECKMAP (Ocvirk et al. 2006b); STARLIGHT (Cid Fernandes et al. 2005); SEDFIT (Walcher et al. 2006) and ULySS (Koleva et al. 2009). Using these new tools, one can fit an observed spectrum in terms of a model built by a linear combination of a number of SSPs with different ages and metallicities. The kinematics can be calculated at the same time by convolving the model with a Gaussian line-of-sight velocity distribution. In some cases, dust can be modeled assuming a reddening law. Figure 7 shows an example of a fit to the integrated spectrum of NGC 628 using the code STECKMAP (Ocvirk et al. 2006b, 2006a), together with the derived flux and mass fractions for stars of different ages and the age-metallicity relation (Sánchez-Blázquez et al. 2014).
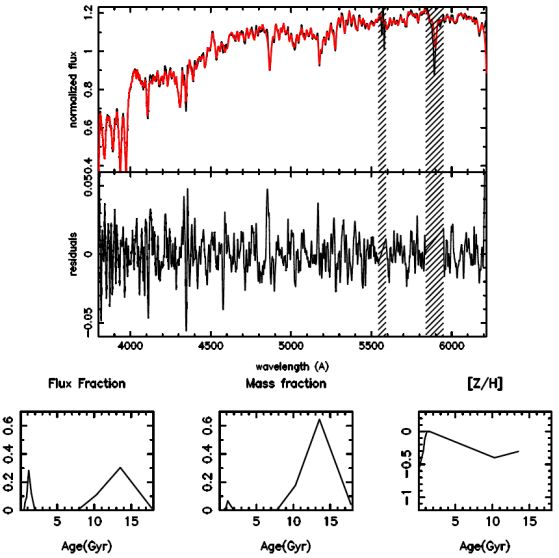 |
Figure 7. Top panel: Example of the fit (red line) obtained with STECKMAP for the integrated spectrum of NGC 628 (black line). The residuals from the fit (observed-fitted) are also showed. Hashed regions indicate those zones that were masked during the fit. Bottom panels: Mass, flux fractions and the age-metallicity relation derived with STECKMAP for the integrated spectrum of NGC 628. From Sánchez-Blázquez et al. (2014). |
The problem of inverting a spectrum to derive detailed star formation and chemical enrichment histories is ill-conditioned – i.e., small fluctuations in the data can produce strong variations in the final solution – and different codes try to overcome these issue with different methods. The accuracy of the recovered star formation history depends critically on the signal-to-noise of the input spectra and, depending on this value, one can recover more or less different stellar populations described by an age and a metallicity. However, with spectra of enough quality, the methods have shown that they can recover reliably both the age distribution and the age-metallicity relation (see, e.g. Cid Fernandes et al. 2005, Ocvirk et al. 2006b, Sánchez-Blázquez et al. 2011).
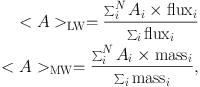
Robust quantities, even when derived from a spectrum with low signal-to-noise, are the mean values of age and metallicity (Cid Fernandes et al. 2005) that are usually weighted with the light (LW) or the mass (MW) of the stars. These are obtained as:
 |
(1) (2) |
where A represents the physical parameter (age or metallicity) and massi and fluxi are, respectively, the reconstructed mass and flux contributions of the stars in the i-th age bin, as returned by the code. When present, young stars are very luminous in the optical and, therefore, contribute more to the light-weighted values. This means that the light-weighted values of age will be biased towards the youngest stellar components. The mass-weighted values will be less biased but they are also more uncertain, as the contribution to mass by low-mass faint stars can be very important.
It is interesting to make a comparison between the SSP-equivalent parameters and the averaged ones obtained from the full star formation history. This comparison was made by Trager & Somerville (2009). In their work, the authors derived stellar population parameters from synthetic spectra generated by a hierarchical galaxy formation model. Figure 8 shows the comparison of the SSP-equivalent ages and metallicities with the mean values weighted with both light (in the V-band) and mass. As can be seen, the SSP-equivalent ages are always lower than both the luminosity- and mass-weighted averages. In particular, SSP-equivalent ages reflect more closely the age of the last episode of star formation while luminosity-weighted means, although still biased towards the ages of the youngest components, are closer to the unweighted mean. On the other hand, SSP-equivalent metallicities and abundance ratios are less severely biased.
 |
Figure 8. Comparison of the SSP-equivalent age and metallicity as a function of mass-weighted (left-hand panels) and V-band light-weighted values (right-hand panels) for models of early-type galaxies drawn from 20 realizations of a Coma cluster-size halo. Figure from Trager & Somerville (2009). |
Some studies have used the non-parametric techniques to analyze the star formation histories of galaxy bulges (MacArthur et al. 2009, Sánchez-Blázquez et al. 2011, González Delgado & et al. 2014). The first conclusion from these studies is that the SSP is a very bad approximation for the star formation history of these objects. Furthermore, MacArthur et al. (2009) and Sánchez-Blázquez et al. (2011) found that in a mass-weighted context, all bulges in their sample were predominantly composed of old stars, independently of their central velocity dispersion. In fact, the previously reported trends of age with central velocity dispersion disappear when mass-weighted values of age are used instead of light weighted ones. This can be seen in Fig. 9, from MacArthur et al. (2009).
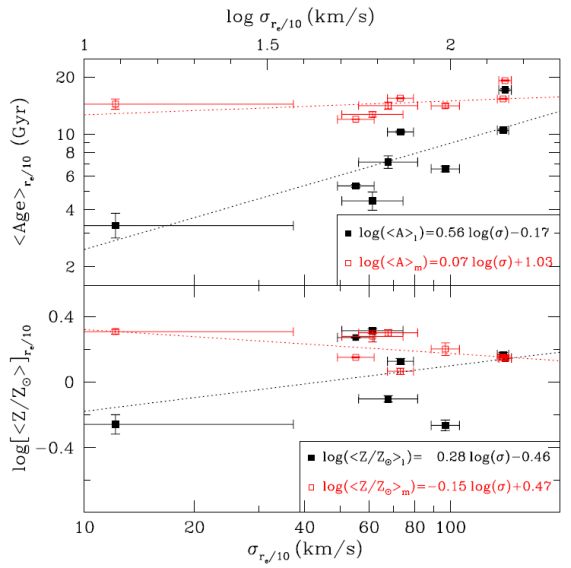 |
Figure 9. Average age and metallicity as a function of velocity dispersion for a sample of face-on bulges. Black solid squares represent light-weighted values while red symbols are mass-weighted. The black and red dotted lines are linear regressions to the light- and mass-weighted data. From MacArthur et al. (2009). |
The result that bulges are dominated, in mass, by old stars applies to all types of bulges (early- and late-type, showing different Sérsic index, and with and without bars). However, this type of analysis has been performed on a very low number of galaxies. It would be desirable to extend this work to a complete sample of bulges covering a range of masses and morphological types. Ideally, one would like to quantify the mass contribution of the young component and correlate this with other properties of the bulges, such as the mass, the environment, the presence of bars, and the spiral arm morphology. This would allow one to study the importance of secular versus external mechanisms in building up the central bulges.
Recent works deriving the star formation history for large samples of spiral galaxies are those performed on data from the CALIFA survey (Pérez & et al. 2013, González Delgado & et al. 2014, Sánchez-Blázquez & et al. 2014. None of these studies has yet especially investigated the population in the bulge, but Pérez & et al. (2013) analyze the mass assembling history of the central parts of galaxies compared with the rest of the galaxy for galaxies of all morphological types binned in mass. They found that galaxies with stellar mass M* > 5 × 10¹⁰ M⊙ have grown quickly their inner part, 5-9 Gyr ago, while lower mass galaxies formed their stars more slowly.
One caveat to all these studies performing full spectral fitting is that they use stellar population models with chemical abundance ratios scaled to solar (e.g. Bruzual & Charlot 2003, Vazdekis et al. 2010). This implies that the models are tuned to the specific chemistry and star formation history of our MW. This is because the empirical spectral libraries are limited to those stars in the solar neighborhood.
While predictions of the strengths of Lick/IDS indices with variable abundance ratios have been made for SSPs of different ages and metallicities (Trager et al. 2000, Thomas et al. 2003, Proctor et al. 2004, Tantalo & Chiosi 2004, Lee & Worthey 2005, Annibali et al. 2007, Schiavon 2007) using a semi-empirical approach, the calculation of the entire spectral energy distribution is more challenging. However, in the last few years, full spectrum fitting models have been extended to include variation in the elemental abundance patterns, using either theoretical stellar libraries or semi-empirical approaches (Coelho et al. 2007, Walcher et al. 2009, Conroy & van Dokkum 2012). The first studies using full spectral fitting to derive chemical abundance ratios of different elements are starting to appear in the literature, all using samples of early-type galaxies (Conroy et al. 2014, Walcher et al. 2009). This is, however, a challenging task, due to the large number of parameters to fit and the possible degeneracies between them.