


The disk galaxies have the bulk of their stars on approximately circular orbits in a disk, most of the rest of the stars in an inner, bulge-like component and finally a small fraction in a round and dynamically insignificant stellar halo surrounding the galaxies. The disk galaxies formed in our simulations are hence qualitatively quite similar to the Milky Way and other disk galaxies. Of the remaining 5 galaxies, two have a minor fraction of the stars on nearly circular, disk orbits; we classify these as lenticulars (S0s), and the remaining three have no stars at all on disk like orbits; we classify these as ellipticals.
The disk galaxies have approximately exponential stellar disk surface density profiles and exponential to r1/4 bulge profiles, all in good agreement with observations. The lenticular and elliptical galaxies are characterized by approximately r1/4 stellar profiles.
The bulges of the disk galaxies are generally confined to being within rB ∼ 1−1.5 kpc from the centers of the galaxies. Bulge-to-disk ratios were determined by extrapolating the nearly exponential disk profiles outside of rB to the center of the galaxies. Using these decompositions (which make no assumptions about the bulge surface density profiles) the specific angular momenta of the stellar disks were estimated taking explicitly into account also the region with overlap between disk and bulge. Characteristic circular speeds Vc for the disk galaxies were calculated using the approach of SLD, but as an addition taking into account also the dynamical effect of the bulges.
In Figure 1 we show the
“normalized” specific angular momenta
 * =
j* / Vc2
of the final disks formed in all
35 disk galaxy simulations as a function of Vc.
As argued by SLGV one expects
disk
to be almost independent of Vc on both theoretical
and observational grounds. Also shown in the figure is the median
“observed” value of
disk,
calculated as in
SLGV and SLD for a Hubble parameter h = 0.65, together with the
observational 1-σ and 2-σ limits. As can be seen from the
figure, the specific angular momenta of the stellar disks from the SPSF
simulations lie only about a factor of two
below the observed median (the specific angular momenta of the disks
from the SPSF simulations have been spin-parameter corrected —
see SLD). This is about an order of magnitude better than
what is obtained in similar CDM simulations without energetically
effective, stellar feedback processes, as discussed by many authors, and
almost as good as was obtained by SLD for WDM. The simulations without
SPSF and the associated, strong feedback events do not do as well.
Also shown in the figure are the normalized specific angular momenta of the
two lenticular and three elliptical galaxies. These
are about an order of magnitude smaller than those of the disk galaxies,
broadly consistent with observations.
* =
j* / Vc2
of the final disks formed in all
35 disk galaxy simulations as a function of Vc.
As argued by SLGV one expects
disk
to be almost independent of Vc on both theoretical
and observational grounds. Also shown in the figure is the median
“observed” value of
disk,
calculated as in
SLGV and SLD for a Hubble parameter h = 0.65, together with the
observational 1-σ and 2-σ limits. As can be seen from the
figure, the specific angular momenta of the stellar disks from the SPSF
simulations lie only about a factor of two
below the observed median (the specific angular momenta of the disks
from the SPSF simulations have been spin-parameter corrected —
see SLD). This is about an order of magnitude better than
what is obtained in similar CDM simulations without energetically
effective, stellar feedback processes, as discussed by many authors, and
almost as good as was obtained by SLD for WDM. The simulations without
SPSF and the associated, strong feedback events do not do as well.
Also shown in the figure are the normalized specific angular momenta of the
two lenticular and three elliptical galaxies. These
are about an order of magnitude smaller than those of the disk galaxies,
broadly consistent with observations.
 |
Figure 1. Normalized specific angular momenta for all galaxies. Filled circles: disk galaxies formed in simulations with SPSF, open circles: disks formed in simulations without SPSF, star symbols: S0's and triangles: E's. |
Figure 2 shows the bulge-to-disk ratios B/D of the 35 disk galaxies versus the birthrate parameter b, which is the ratio of the current to the average past star formation rate. b is a disk galaxy type indicator, with b ∼ 0.1 for Sa's increasing to b ∼ 1 for Sc's (Kennicutt, Tamblyn & Congdon 1994) The trend (or rather, lack of trend) seen in Figure 2 is broadly consistent with observationally determined (and 2-D decomposed) I and K-band B / Ds, which trace the mass bulge-to-disk ratios fairly well - see Sommer-Larsen et al. (2002).
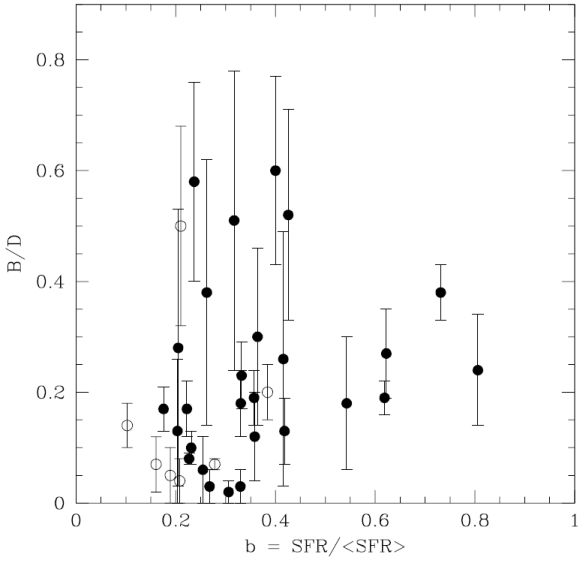 |
Figure 2. Stellar bulge-to-disk ratios for the 35 disk galaxies — symbols as in Fig. 1. |
Integrated B − V colours were obtained for the galaxies by stellar population synthesis techniques. In Fig. 3 we show these for the 35 disk galaxies vs. the b parameter. Also shown are observations — the general agreement is excellent. Finally, in Fig. 4 we show M*(Vc) of the final disk galaxies formed in 35 runs together with the I-band Tully-Fisher relation (TF) for h = 0.65, converted to mass assuming mass-to-light ratios (M / LI) = 0.5, 1.0 and 2.0. The slope of the “theoretical” TF matches that of the observed very well for a constant mass-to-light ratio, which is required to be (M / LI) ∼ 0.8, similar to the findings of SLD for their WDM simulations. Such a low value is consistent with recent, dynamically estimated mass-to-light ratios for disk galaxies, the mass-to-light ratio of the Milky Way (Fig. 4) and can be obtained from stellar population synthesis models provided an IMF somewhat less “bottom-heavy” than the Salpeter law is used (Portinari, Sommer-Larsen & Tantalo 2002, Sommer-Larsen et al. 2002).
 |
Figure 3. Integrated B − V colours for the 35 disk galaxies, calculated using stellar population synthesis techniques — symbols as in Fig. 1. Also shown (solid line) are the mean observational values for disk galaxies from Roberts & Haynes (1994) and the observational 1-σ limits (dotted line). |
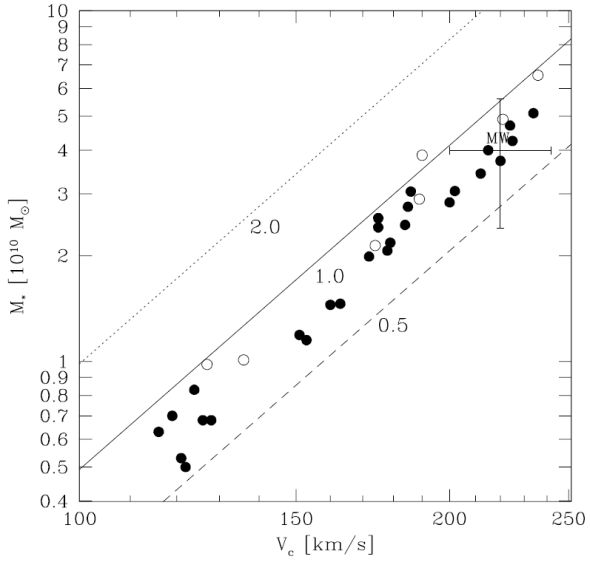 |
Figure 4. The stellar mass “Tully-Fisher” relation for the 35 disk galaxies — symbols as in Fig. 1. Error bars marked MW: The stellar mass of the Milky Way. Lines: observed TF relation for (M / LI) = 0.5, 1.0 and 2.0 - see Sommer-Larsen et al. (2002) for details. |
Acknowledgement
We thank the organizers for an in all aspects truly outstanding conference.