


The main H2 molecule is symmetric and has no dipolar transition. At the low temperature of the interstellar medium ( ∼ 20K), the quadrupolar transitions are not excited, and moreover they have a very weak Einstein coefficient. The main tracer of the molecular gas is then the CO molecule (with solar abundance of CO/H2 ∼ 10−4), tracing the bulk of the gas, with a critical density of the order of 103 - 104 cm−3 for the lowest levels. Other molecules with a higher critical density (more than 2 orders of magnitude higher), like HCN, HCO+ or CS are used as high density tracers. Their intensity is usually 10-30 times lower.
At high redshift, the large advantage of the CO tracer is the high probability to find any line J from the rotational ladder, since the ladder spacing decreases as (1 + z)−1; and when the gas is excited, the line strength of the J levels increases almost as the square of the frequency. There are good reasons to expect higher density molecular gas in high-z galaxies (they are more gas rich, and their volumic density is higher), such that higher excitation is the norm. This situation favors the detection of molecular gas at high-z, while the atomic gas has large difficulties with the unique 21cm line.
The distribution of radiating energy among the various J-lines of the CO ladder called the SLED (Spectral Line Energy Distribution), is a very useful diagnostic of the physics of the emitting interstellar medium (ISM), in particular its density and temperature. It has been shown that the CO SLED can distinguish between quiescent Milky Way-like galaxies, where the emission is peaking at J = 3, and dense and warm starbursts, where the peak is up to J = 8 (Weiß et al, 2007). These excitations come from star formation processes (PDR, or photo-dissociation regions), but near AGN, higher excitation is possible, in particular through hard X-rays (XDR, or X-ray dominated regions) (van der Werf et al, 2010). In some cases of very concentrated starbursts, the dust opacity could also perturb the SLED (Papadopoulos et al, 2010).
At high redshift, galaxies have a higher gas fraction, the gas is denser, and star formation rates are higher in average. It is therefore expected that the CO lines are more excited, favoring the detection of the molecular gas. There is also the possibility of radiative excitation from the cosmic background, which temperature varies in (1 + z), reaching ∼ 30K at z = 9. It is not obvious that this excitation helps the detection, since the detected signal is only the excess above the background. This has been simulated, and indeed, there is no negative K-correction for the CO lines, contrary to the dust continuum emission, (e.g. Combes et al, 1999, da Cunha et al, 2013).
The derivation of the molecular content from the CO lines relies on the CO-to-H2 conversion factor, well calibrated at low redshift, and in particular in the Milky Way: clouds are then detected individually, and their virial masses estimated. The conversion factor has a robust statistical value, when averaged over a large cloud population, with a wide range of masses and densities. The factor depends however strongly on gas metallicity (e.g. Bolatto et al, 2013). It is possible to quantify the fraction of diffuse and clumpy components, with high density tracers such as HCO+, HCN, allowing to refine the conversion factor. For example Oteo et al (2017) have shown with ALMA that the excitation of HCO+, HCN and HNC in two lensed dusty starbursts at z ∼ 2 is very similar to what is already known in local IR-bright galaxies. Due to the virial hypothesis, the conversion factor is thought to vary as the square root of the H2 volumic density, divided by the brightness temperature of the clouds, ∝ n(H2)1/2 / TB. In local starbursts, both the cloud brightness and their density increases, which limits the variation of the ratio (e.g. Leroy et al, 2011). The metallicity is however a serious problem, since it is thought to decrease with redshift. Using one of the first large surveys of star forming galaxies at z > 1, Genzel et al (2012) have estimated the variation of the conversion factor with metallicity (see Figure 1).
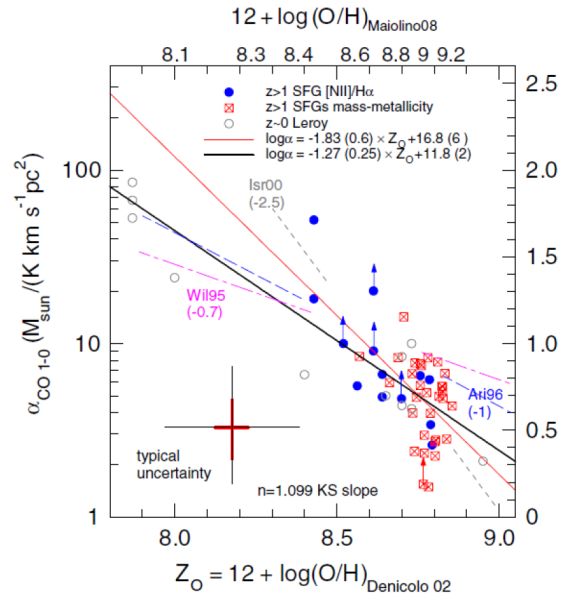 |
Figure 1. The derived conversion factor between the CO(1-0) luminosity and the molecular gas mass, αCO as a function of metallicity in the gas phase. The molecular gas mass is computed independently of the CO luminosity from the SFR and the Kennicutt-Schmidt (KS) relation, with a slope n = 1.1. The gray circles are for local galaxies (Leroy et al, 2011). The gas metallicity for high-z blue-symbol galaxies have been obtained from the [NII] / Hα flux ratio, converted to oxygen abundance scale from Denicoló et al (2002) and Maiolino et al (2008). The red symbols are galaxies where metallicity is derived from the total stellar mass. Image reproduced with permission from Genzel et al (2012), copyright by AAS. |
A complementary way to probe the interstellar medium of high redshift galaxies is from absorption lines in front of a strong millimeter continuum source. These molecular lines can provide information on the chemistry and its evolution with z, and also the physical conditions of the gas (density, temperature). The lines may be very narrow (< 1km/s) and useful to constrain the variations of fundamental constants. The absorbing systems before ALMA were only 4-5 (e.g. Combes, 2008). With ALMA, it was possible to carry on a molecular survey towards the system PKS1830-211, corresponding to two gravitational images and an Einstein ring in the absorbing foreground lens (Muller et al, 2014). In particular, isotopes of the chloronium were detected, and OH+, H2O+ have allowed to measure the molecular gas fraction and the ionization rate of the gas, in several lines of sight (Muller et al, 2016). With ALMA, new molecular lines are detected in z = 0.5-1 absorbers (e.g. Wiklind et al, 2018), but also a large number in more local radio sources (David et al, 2014, Tremblay et al, 2016), where the absorptions are determinant to disentangle inflows from outflows.