


The variations of the slopes of the spectral energy
distributions (SED) as a function of
 100, radial density
distribution law, type of exciting star etc. are quantified
as colours directly observable using the
ISOPHOT. Details about the choice of filters and their
characteristics (Table 5 in
Paper I) have been presented in
Paper I.
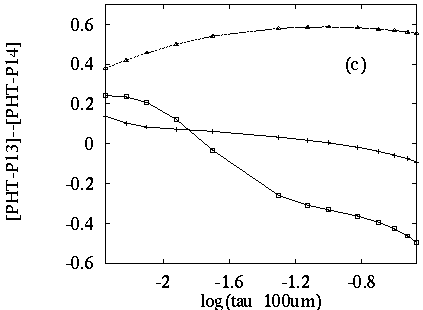
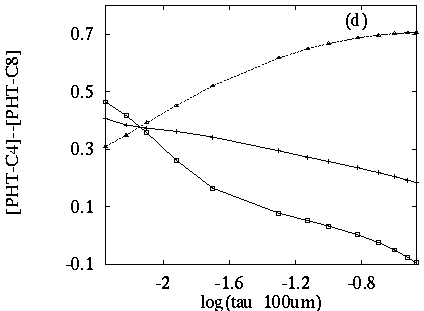
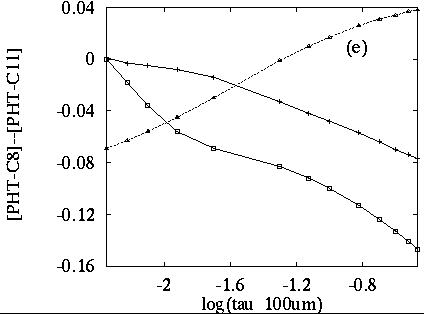
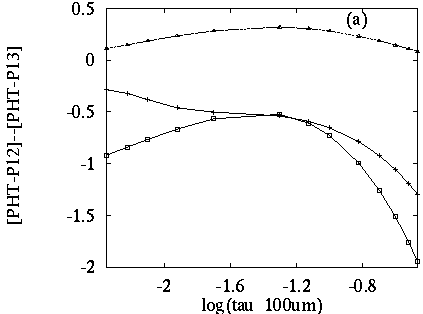
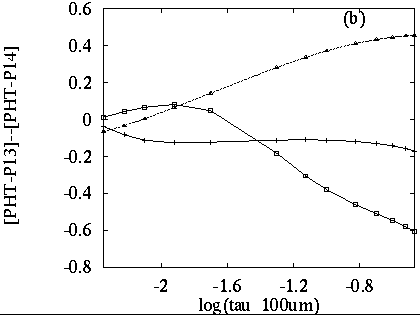
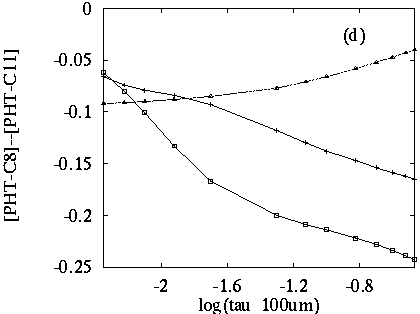
Figures 1, 2 and
3
represent the variation of colours
as a function of 100,
corresponding to a central star of type
O4, O7 and B0.5 respectively. In each figure the model predictions
corresponding to dust density profiles varying as r0,
r-1 and r-2 are presented.
100, radial density
distribution law, type of exciting star etc. are quantified
as colours directly observable using the
ISOPHOT. Details about the choice of filters and their
characteristics (Table 5 in
Paper I) have been presented in
Paper I.
Figures 1, 2 and
3
represent the variation of colours
as a function of 100,
corresponding to a central star of type
O4, O7 and B0.5 respectively. In each figure the model predictions
corresponding to dust density profiles varying as r0,
r-1 and r-2 are presented.
| 
|
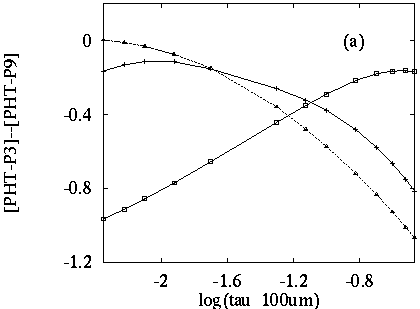
Figure 1. Plots of colours as a
function of
optical depth | |
| 
|
| 
|
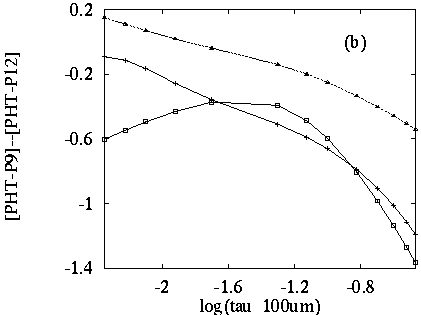
| Figure 2. Plots of colours as a
function of optical depth,
|
| 
|

| 
|
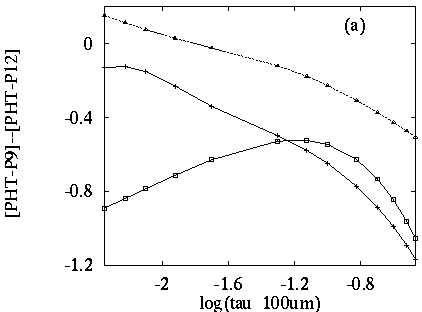
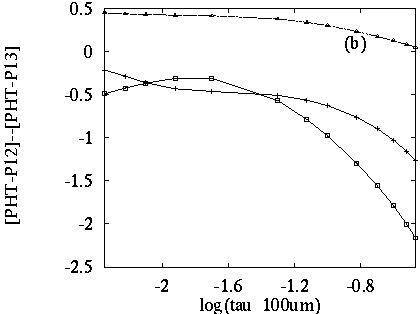
Figure 3. Plots of colours as a
function of optical depth,
| |
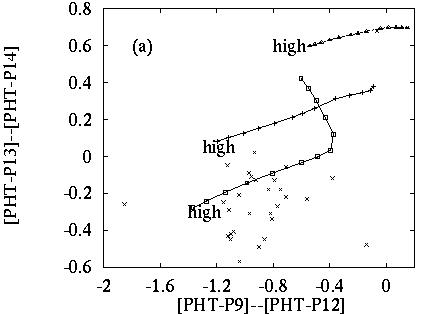
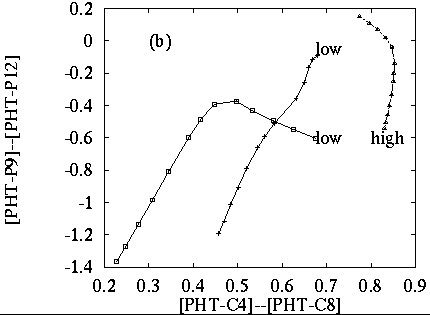
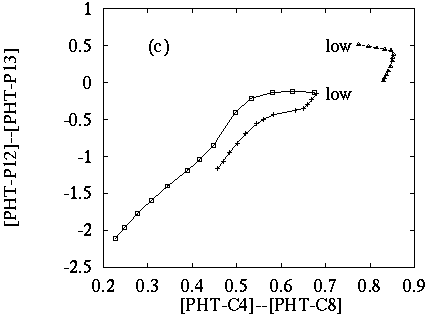
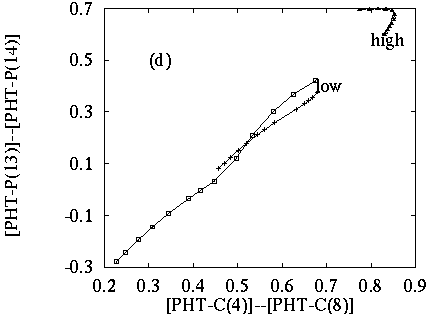
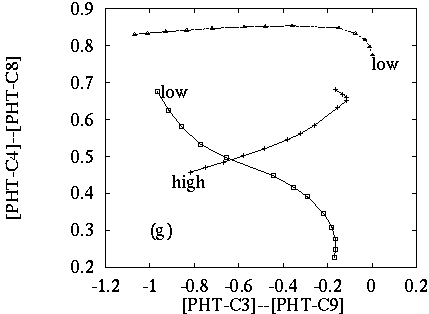
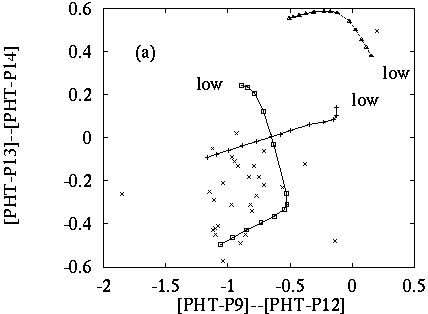
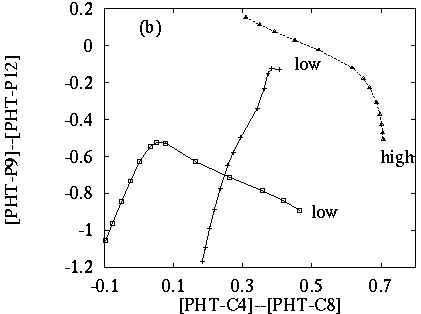
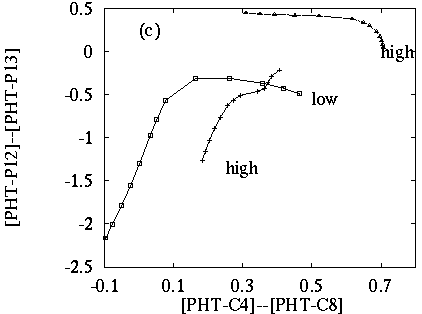
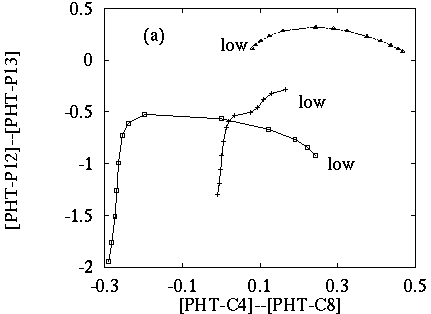
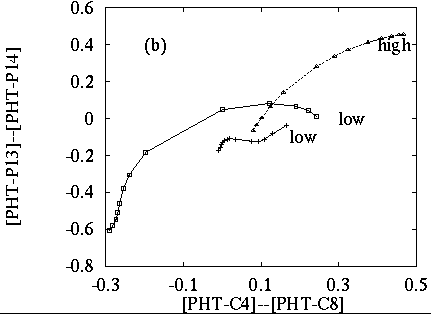
A few colour-colour plots, selected on the basis of their diagnostic values are presented in Figures 4, 5 and 6. While selecting the colours, it has been ensured that there is no filter, which is common to both the axes, so that any correlation seen, can be regarded as genuine.
| 
|
| 
|

| 
|
| Figure 4. Colour-colour plots with O4 as
the central star. The symbols box,
+ and triangle are for r0, r-1 and r-2
density distributions respectively. ``high''= higher
|
| 
|
| 
|
Figure 5. Colour-colour plots with O7 as
the central star. The symbols box,
+ and triangle are for r0, r-1 and r-2
density distributions respectively. ``high''= higher
| |
| 
|
Figure 6. Colour-colour plots
with B0.5 as the central star. The symbols box,
+ and triangle are for r0, r-1 and r-2
density distributions respectively. ``high''= higher
| |
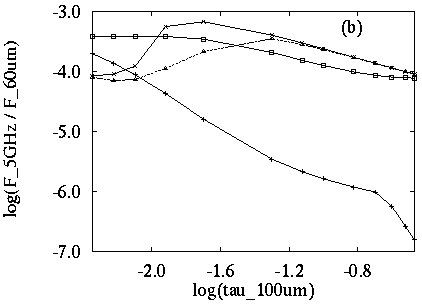
Figure 7 presents the variation of the ratio of the predicted radio continuum flux density at 5 GHz and the FIR flux density at 60 µm, with the optical depth. The different curves correspond to the different density distributions, as explained in their captions. In this figure, there are two curves corresponding to the r-2 distribution, for different assumptions about the inner radius of the gas cloud (details in Section 4.4).

| 
|
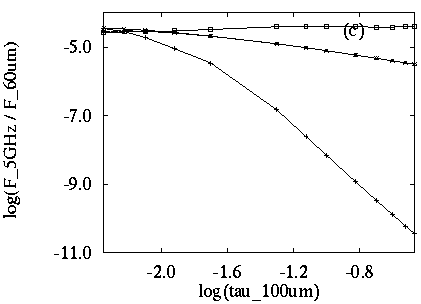
| Figure 7. Plots of log of the ratio of
radio flux density (F5GHz) at 5GHz
to the FIR flux density (F60µm) at 60
µm as a function of the total radial optical depth
( |
 and x are for
r-2 distribution with r* = (Rmin / 2)
and with r* =
(Rmin / 10) respectively.
and x are for
r-2 distribution with r* = (Rmin / 2)
and with r* =
(Rmin / 10) respectively.