

4.6. Information from the Line Emission
The diagnostic value of the fine structure lines have been quantified in terms of lines detectable above the continuum, for the spectrometers ISO-LWS and ISO-SWS, for realistic instrumental resolution. The number of detectable lines depends on the type of exciting star, the radial density profile and the absolute values for the densities of the gas and the dust, with relative abundance of elements being the same for all models. In general, the number of detectable lines (D > -1.00) reduces as one goes from O4 to O7 to B0.5, as the luminosity and effective temperature of the embedded star reduces. Also for the r0 case, the detectable lines are more numerous than r-1 case. Similarly r-1 case has more lines than the r-2 case in general.
In addition to the absolute luminosities of these lines, it is important to know the line to continuum contrast, the parameter D, which identifies lines that are more easily detectable. The values of D are also listed in Table 6, along with the line luminosities, for the selected models.
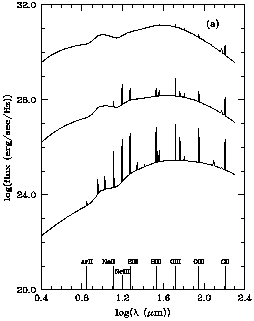
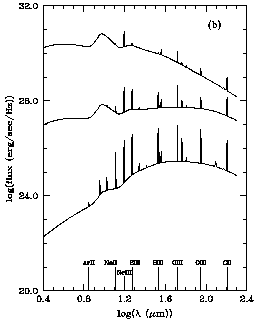
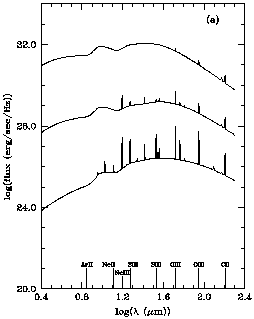
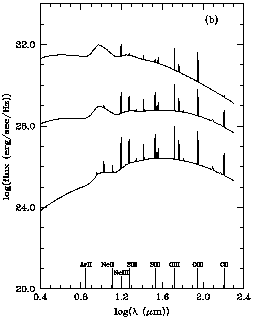
We note that for O4 star and r0 density distribution (Table 6), the [O III] (51.8 µm) line happens to be the most luminous. However, from the viewpoint of the line to continuum ratio, for the same family of models, the [O III] (88.4 µm) line is found to have the best detectability. This suggests that while the absolute luminosity of the lines are helpful for understanding the different physical parameters, the relative contrast of the lines with respect to the local continuum bear useful information about the actual appearance of the spectrum and hence the detectability of a particular line. The latter is extremely useful from the observation point of view. Based on the results presented here (Table 6 & Figs. 8 - 10), many quantitative inferences can be drawn, like the following : (i) exact luminosity as well as detectability (for the ISO spectrometers) sequence of spectral lines; (ii) role of a particular line in cooling of the interstellar medium (ISM) near H II regions; (iii) relative roles of different elements in the energetics of the ISM; (iv) expected line ratios for the same species (being abundance independent) under different physical conditions in / near H II regions, as a function of optical depth & density distribution; (v) the role of the continuum from the dust, in highlighting or suppressing expected detection of various fine structure lines; etc.

| 
|
Figure 9. Same as in Fig. 8, but for the case of a ZAMS star of O7 type embedded in the cloud. | |
From the above it is very clear that the details of optical depth, the exciting stellar type (luminosity and effective temperature) as well as the dust density distribution are well imprinted on the emergent line spectrum of the compact H II region. Hence, the present study has quantitatively demonstrated the diagnostic value of several fine structure lines of abundant elements in the interstellar medium. The same can be used extensively in studies dealing with ISO spectrometer in near future.

| 
|
Figure 10. Same as in Fig. 8, but for the case of a ZAMS star of B0.5 type embedded in the cloud. | |
Within the published ISO-SWS spectra, though with limited wavelength
coverage of compact H II regions
(Roelfsema et
al. 1996) we notice that one of their sources viz.,
IRAS 21190+5140,
approximately matches our prediction for a O7 star embedded
in a uniform density of total radial
 100µm = 0.0045.
Not only the two line luminosities at 8.99 µm [Ar III]
and 10.5 µm [SIV], but also the nearby continuum are
roughly matching the predictions. This is only to indicate
the usefulness of the present results. Obviously a
finer tuning of the parameters near these values would be needed before
firm conclusions can be drawn about this source.