


The spectrum of NGC 4214 can be considered representative of galaxies in physical conditions similar to those of the Orion Nebula and the Nebula Cluster; the spectrum of this galaxy closely resembles that of the inner part of the Orion Nebula in the neighborhood of the Trapezium. He I is in emission, and the continuous spectrum extends far out into the violet. A Yerkes spectrogram of the faintest of the Orion Nebula Trapezium stars illustrates clearly how the helium absorption lines in an early B-type star can be suppressed by the superposition of emission lines from a gaseous substratum. In the case of NGC 4214, this has apparently taken place on a very large scale; and the circumstance has made the determination of an accurate spectral type impossible.
Irregular systems similar to NGC 4449 (and perhaps the Large Magellanic Cloud) are of somewhat later type; in spectra of these systems, He I is observed in absorption. The spectra of galaxies similar to NGC 4490 are somewhat later still.
At the other extreme of the form classification illustrated in Figure 1, the galaxies have spectra of class K, and certain spectroscopic features indicate large percentages of yellow giant stars; these spectra have been described by Morgan and Mayall. McDonald spectrograms of the nuclear region of M31, a transparent region near the nucleus of our Galaxy, and two globular clusters of late spectral type are illustrated in Figure 3. All are of spectral type K. Night-sky emission lines affect the spectrum of the nuclear region of the Galaxy for wavelengths shorter than the G band.
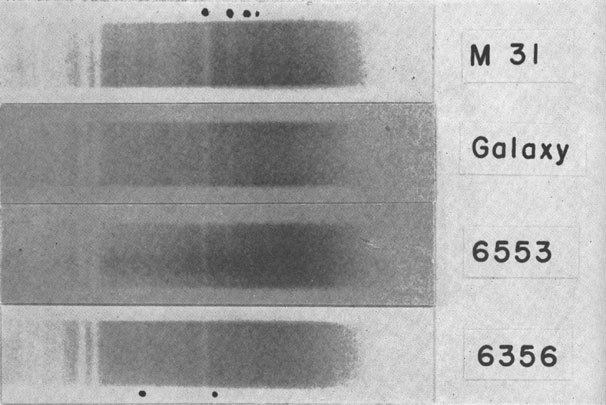 |
Figure 3. Reproductions of McDonald
spectrograms of (1) the
nuclear region of M31; (2) a transparent region about 3° distant
from the nucleus of our Galaxy; and (3) integrated spectra of the
globular clusters NGC 6553 and NGC 6356, which are representative of
the strong-lined category of globulars. The metallic lines are
somewhat stronger in NGC 6553 than in NGC 6356. Green is at right, and
violet at left. The G band and two blended metallic absorptions are
marked in the spectrum of M31; the small dot at the right marks an
emission-like feature which is, in fact, a gap between groups of
strong absorption lines.
|
In the infrared region, the observations of Morgan and Mayall have shown titanium oxide bands to be present in the nuclear region of M31. Earlier evidence of a somewhat different kind is available concerning the nature of the brightest red stars in the nuclear region of our Galaxy: the discovery by Nassau of the presence of very large numbers of late M-type giants near the Galactic nucleus is one of the most important developments of the mid-century period in astronomy. This discovery does not appear to have had the recognition it deserves; because of Nassau's discovery, it is now possible to study individually the characteristics of these red giant stars which are, without any question, concentrated in the Galactic nuclear bulge. A beginning on such a program was made by Baade, and the possibilities for the future are extremely promising.
The integrated spectral type of star clusters ranges from the Orion Nebula cluster at one extreme to the strong-lined globular clusters in the region of the Galactic nucleus at the other. The range in integrated spectral type for galaxies seems to be almost identically the same. A schematic diagram of these results is given in Figure 4. We therefore conclude that, so far as the contribution to the luminosity in the blue and violet region is concerned, the range in integrated spectral type - and spectral characteristics - among star clusters agrees closely with the range observed among galaxies.
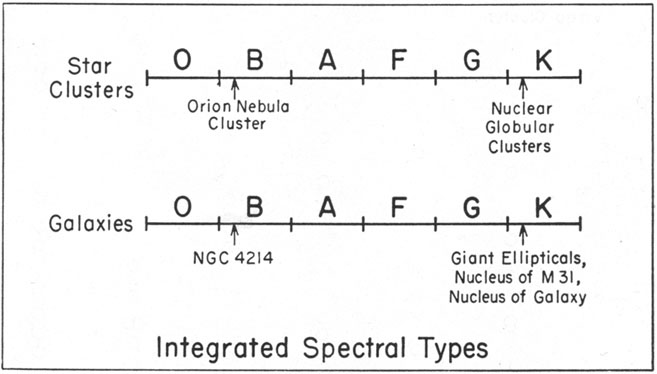 |
Figure 4. Schematic diagram illustrating range in integrated spectral type observed for star clusters and for galaxies. |
 and
H
and
H are marked in the spectrum of NGC 6356.