


2.1 Line-Intensity
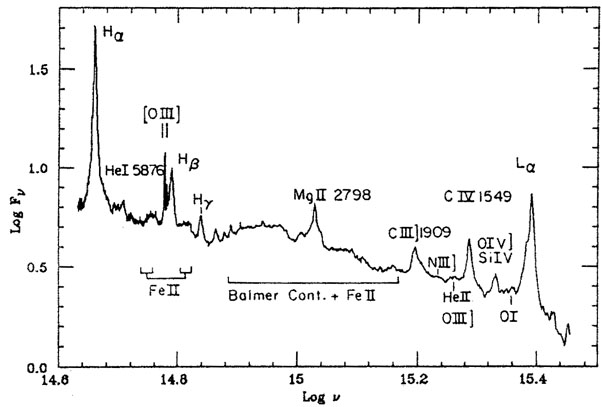
Emission line intensities and emission line ratios supply information on the physical conditions in the line emitting gas. The electron density and temperature, the degree of ionization and excitation and the chemical composition, can all be deduced from line ratio analysis. There are some 20 broad lines, and a similar number of narrow lines, that can be measured in a single AGN, and the amount of information conveyed by the many line ratios is very large. Fig. 2, which is a composite spectrum of a large number of quasars, shows many of these lines and Table 1 contains a representative line intensity list for the main AGN groups discussed in chapter 1.
A characteristic feature of all broad line objects is the presence, in
their spectrum, of both high and low excitation lines. Examples are
OVI 1035 and
MgII2798, both very strong in
many quasars. The low
excitation lines indicate regions of low ionization and suggest that
at least part of the gas is neutral and optically thick to the Lyman
continuum radiation. This can be put to a simple observational test,
as discussed below. The high excitation lines indicate highly ionized
material. A fundamental issue, that ought to be addressed, is whether
the high and low excitation lines originate in the same part of the
emission line region.
1035 and
MgII2798, both very strong in
many quasars. The low
excitation lines indicate regions of low ionization and suggest that
at least part of the gas is neutral and optically thick to the Lyman
continuum radiation. This can be put to a simple observational test,
as discussed below. The high excitation lines indicate highly ionized
material. A fundamental issue, that ought to be addressed, is whether
the high and low excitation lines originate in the same part of the
emission line region.
|
Figure 2. A composite spectrum, obtained from the addition of spectra of quasars with different redshifts (courtesy of J. Baldwin). |
An interesting property of AGNs is the great similarity of line ratios in objects of very different luminosities. Thus, the composite spectrum shown in Table 1 is indeed representative of the spectrum of many individual objects. This must indicate that the physical conditions in the line emitting gas are similar in bright and faint objects. As a result, much of the following analysis is aimed at the understanding of this canonical spectrum, rather than the observations of a particular object. All this, and more, is the subject of chapters 4-6.
| Line | Quasars and Seyfert 1s | Seyfert 2 and NLXGs | LINERs |
| (broad + narrow) | (narrow) | (narrow) | |
| CIII977
| < 1 | ||
| OVI1035 | 3 | ||
L
| 8-15 | 30-70 | |
| NV1240
| 3 | ||
| OI1304
| 0.5 | ||
| CII1336
| 0.3 | ||
| SiIV,OIV]1400
| 1.3 | ||
| NIV]1486
| 0.7 | ||
| CIV1549 | 5-8 | 5-20 | |
| HeII1640
| 0.6 | ||
| OIII]1663
| 0.5 | ||
| NIII]1750
| 0.4 | ||
| CIII]1909
| 2-4 | 2-8 | |
| FeII (2200-2800Å) | 5-10 | ||
| MgII2798
| 3 | 1-3 | |
| [NeV]3426
| 0.2 | 1 | |
| [OII]3727
| 0.3 | 1-4 | 2-5 |
| [NeIII]3869
| 0.5 | 1.5 | 0.3 |
| HeII4686
| 0.1 | ||
H
| 1 | 1 | 1 |
| [OIII]5007
| 0.1-1 | 8-15 | 1-2 |
| FeII(4500-5400Å) | 1-3 | ||
| HeI5876
| 0.1-0.2 | 0.15 | 0.1 |
| [FeVII]6087
| 0.1 | ||
| [OI]6300
| 0.05 | 0.6 | 1 |
| [FeX]6374
| 0.01-0.08 | ||
| H
| 4-6 | 2.8-3.3 | 2.8-3 |
| [NII]6583
| 0.1-0.3 | 0.6-1.5 | 2-4 |
| [SII]6716,6731
| 0.2 | 1 | 2-3 |
| CaII8498-8662
| 0-0.3 | ||
| [SIII]9069,9532
| 0.3 | ||
| P
| 0.4 | ||
| L(H) (erg s-1)
| 1042-46 | 1040-42 | 1038-41 |
| EW(H)
| 100 Å | 5-30 Å | 1-10 Å |
* Reddening corrections have been
applied to the narrow lines. The
H | |||